Deploying K10
Deploying Kasten K10 is a simple helm chart deployment that I covered in a post a few months back here.
➜ kubectl create ns kasten-io
namespace/kasten-io created
➜ helm install k10 kasten/k10 --namespace=kasten-io
Accessing K10
For the purposes of this demo, I am just port forwarding each cluster out, but you could use ingress to expose to specific network addresses, If I was going to do this again though I would setup ingress on each of the clusters and then this would slightly change the inlets configuration.
Multi-cluster setup-primary
We have 3 clusters, and we need to decide our primary cluster so that we can start the configuration and bootstrap process. In this demo I have chosen the CIVO cluster located in NYC1. More about this configuration setup can be found here in the official documentation.
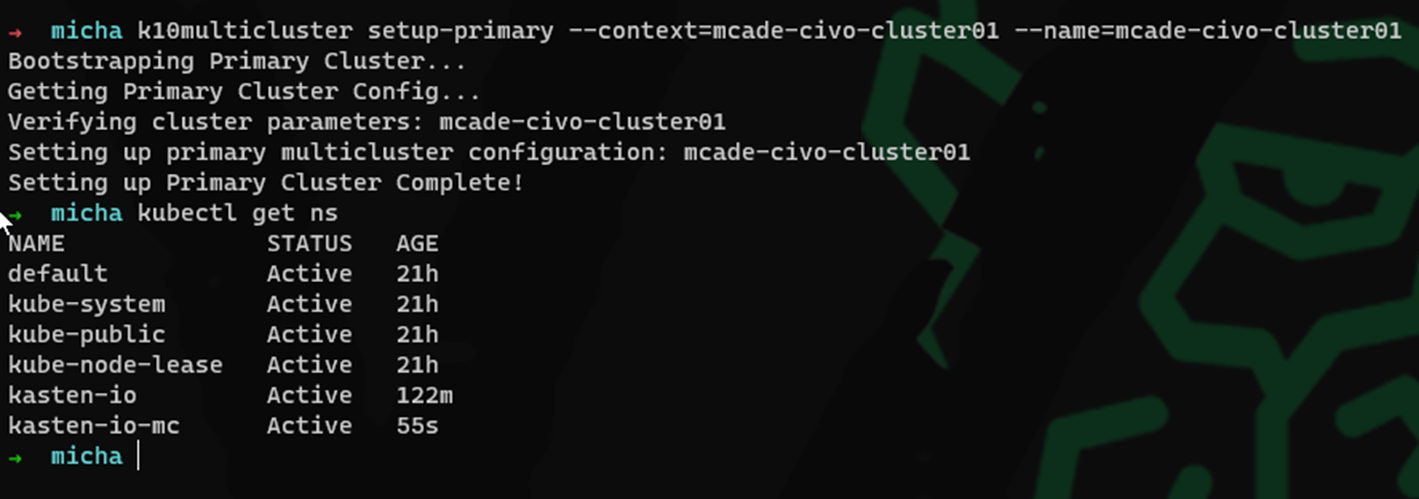
You will see from the commands and the images below that we are using the K10multicluster tool this is a binary available from the Kasten github page and it provides the functionality of bootstrapping your multi cluster configurations.
k10multicluster setup-primary --context=mcade-civo-cluster01 --name=mcade-civo-cluster01
Bootstrap the secondary (dark site)
The main purpose of the demo is to prove that we can add our local K3D cluster from a data management perspective in one location.
k10multicluster bootstrap --primary-context=mcade-civo-cluster01 --primary-name=mcade-civo-cluster01 --secondary-context=k3d-darksite --secondary-name=k3d-darksite --secondary-cluster-ingress-tls-insecure=true --secondary-cluster-ingress=http://209.97.177.194:8080/k10
or
k10multicluster bootstrap \
--primary-context=mcade-civo-cluster01v \
--primary-name=mcade-civo-cluster01 \
--secondary-context=k3d-darksite \
--secondary-name=k3d-darksite \
--secondary-cluster-ingress-tls-insecure=true \
--secondary-cluster-ingress=http://209.97.177.194:8080/k10

Managing Kasten K10 multi-cluster
I will make more content going into more detail about Kasten K10 multi cluster but for the purposes of the demo, if you now login to your primary cluster web interface you will now have the multi cluster dashboard and with the above commands ran you will now see that we are managing the K3d cluster.
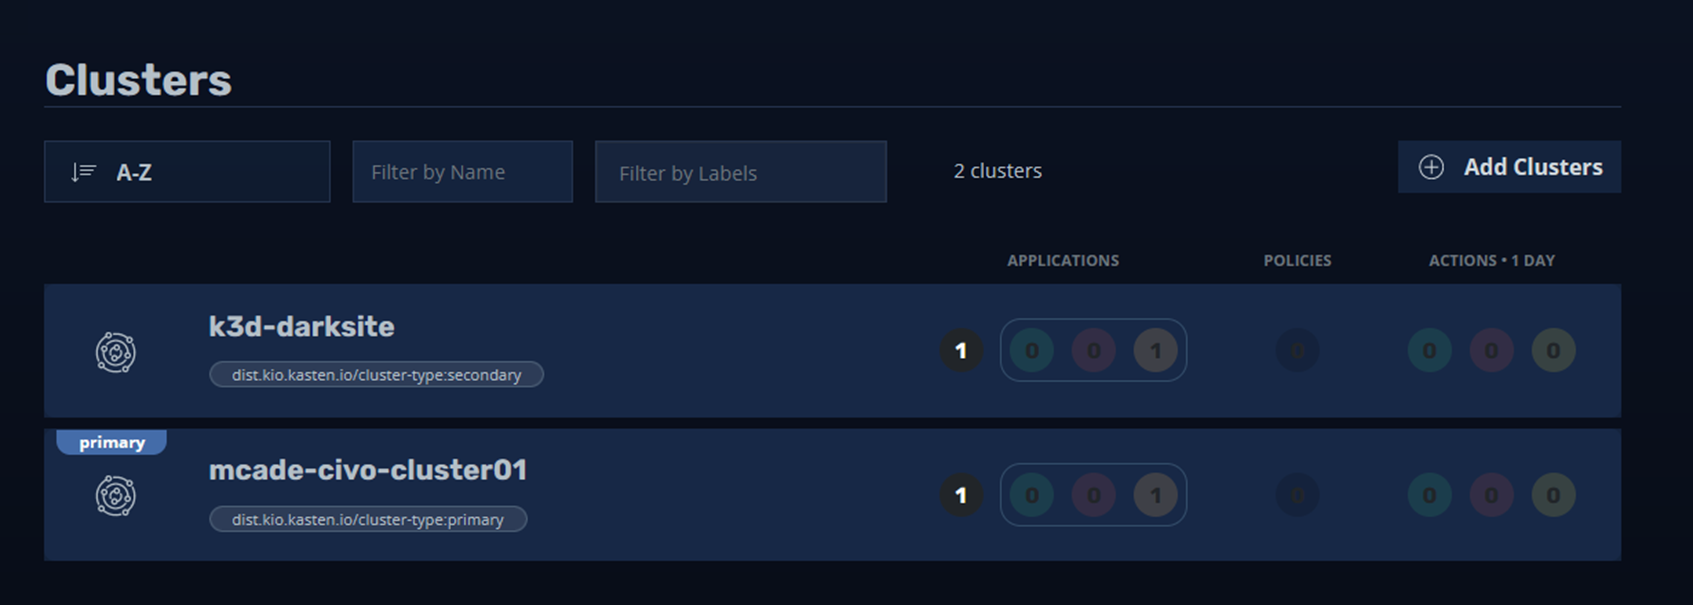
From here we can create global backup policies and other global configurations which also could enable the ability to move applications between your clusters easily. I think there is a lot more to cover when it comes to multi cluster and the capabilities there. The purpose of this blog was to highlight how inlets could enable not only access to the Kubernetes API but also to other services within your Kubernetes clusters.
You will have noticed in the above that I am using TLS insecure, this was due to me changing my environment throughout the demo. Inlets very much enables you to use TLS and have verification on.
Useful Resources
I mentioned in the first post that I would also share some useful posts that I used to get things up and running here. As well as a lot of help from Alex Ellis
https://blog.alexellis.io/get-private-kubectl-access-anywhere/
https://docs.inlets.dev/#/?id=for-companies-hybrid-cloud-multi-cluster-and-partner-access
https://inlets.dev/blog/2021/06/02/argocd-private-clusters.html
I have obviously used Kasten K10 and the Kubernetes API but this same process could be used for anything within side a private environment that needs to be punched out to the internet for access.
]]>What is the problem?
How do you access dark sites over the internet?
How do you access dark Kubernetes clusters over the internet? Not to be confused with dark deployment or A/B testing.
Do you really want a full-blown VPN configuration to put in place?
If you are collaborating amongst multiple developers do you want KUBECONFIGS shared everywhere?
And my concern and reason for writing this post is around how would Kasten K10 Multi-Cluster access a dark site Kubernetes cluster to provide data management to that cluster and data?

What is Inlets?

First, I went looking for a solution, I could have implemented a VPN so that people could VPN into my entire network and then get to the K3D cluster I have locally, this seems to be an overkill and complicated way to give access. It’s a much bigger opening than is needed.
Anyway, Inlets enables “Self-hosted tunnels, to connect anything.”
Another important pro to inlets is that it replaces opening firewall-ports, setting up VPNs, managing IP ranges, and keeping track of port-forwarding rules.
I was looking for something that would provide a service that would provide a secure public endpoint for my Kubernetes cluster (6443) and Kasten K10 deployment (8080) which would not normally or otherwise be publicly reachable.
You can find a lot more information about Inlets here at https://inlets.dev/ I am also going to share some very good blog posts that helped me along the way later in this post.
Let’s now paint the picture
What if we have some public cloud clusters but we also have some private clusters maybe running locally on our laptops or even dark sites? For the example I am using CIVO in my last post I went through how I went through the UI and CLI to create these clusters and as they were there, I wanted to take advantage of that. As you can also see we have our local K3D cluster running locally within my network. With the CIVO clusters we have our KUBECONFIG files available with our public IP to access, the managed service offerings make it much simpler to have that public IP ingress to your cluster, it is a little different when you are on home ISP backed Internet, but you still have a requirement.
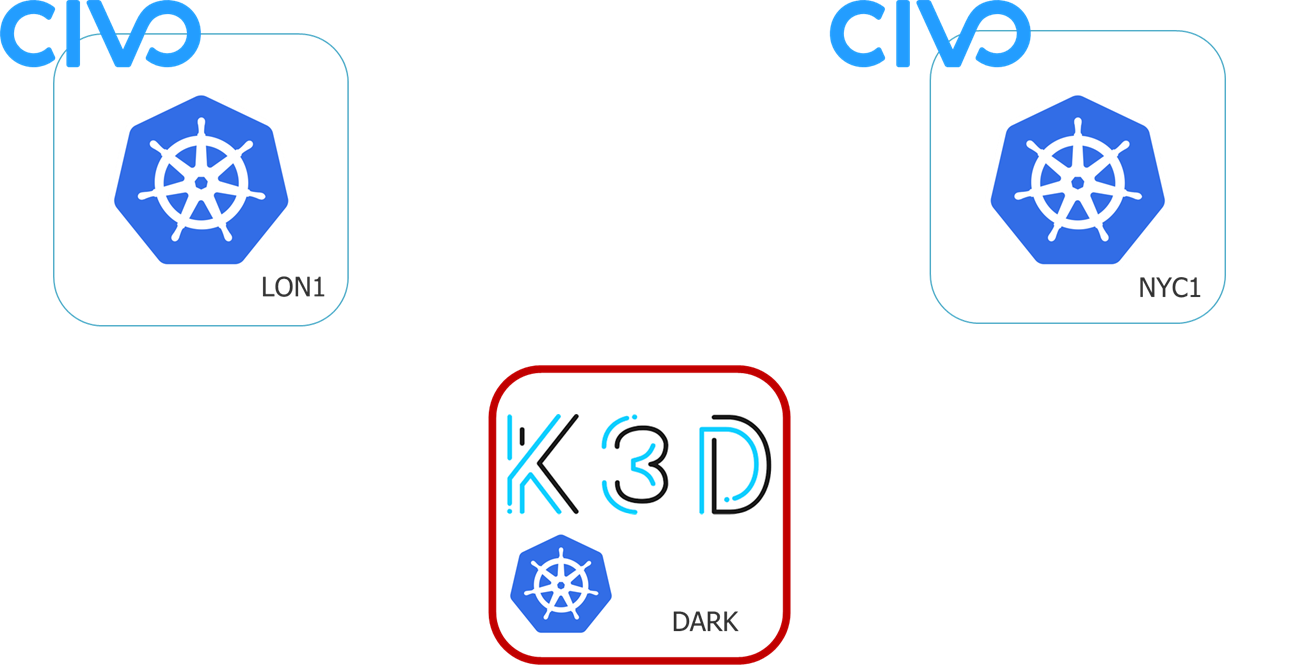
My local K3D Cluster
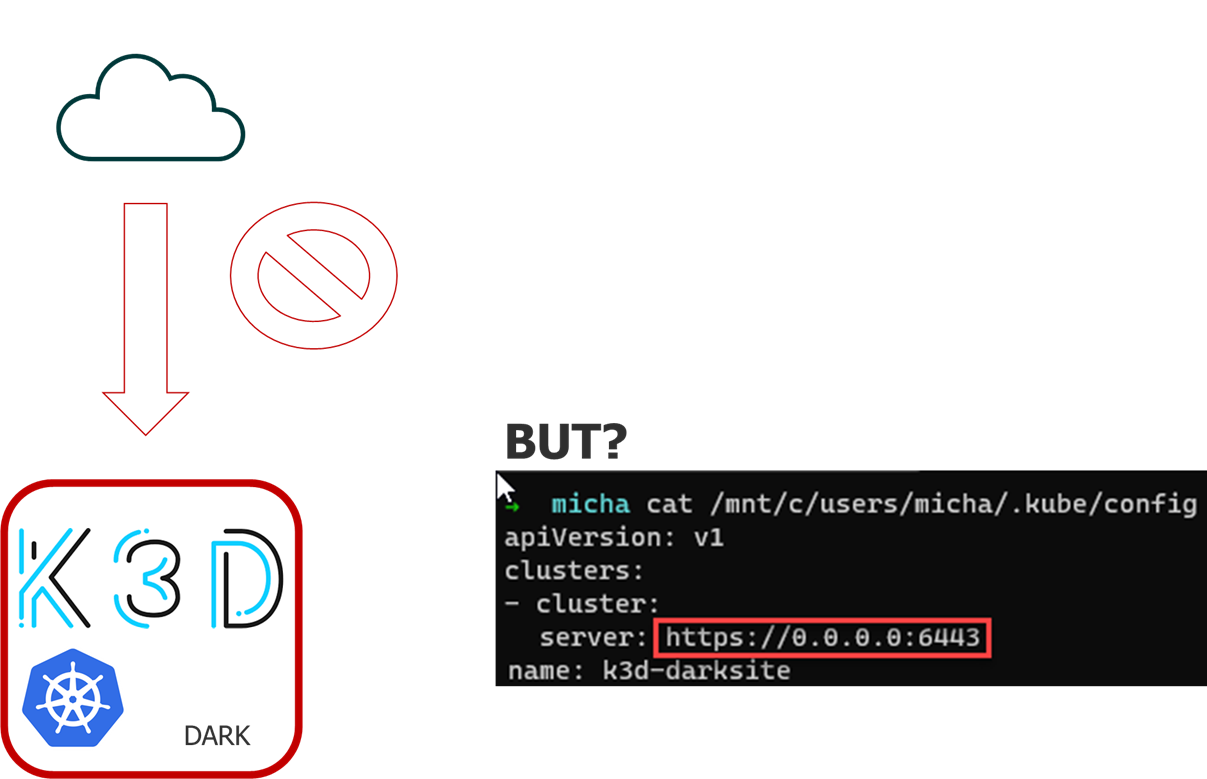
If you were not on my network, you would have no access from the internet to my cluster. Which for one stops any collaboration but also stops me being able to use Kasten K10 to protect my stateful workloads within this cluster.
Now for the steps to change this access
There are 6 steps to get this up and running,
- Install inletscli on dev machine to deploy exit-server (taken from https://docs.inlets.dev/#/ – The remote server is called an “exit-node” or “exit-server” because that is where traffic from the private network appears. The user’s laptop has gained a “VirtualIP” and users on the Internet can now connect to it using that IP.)
- Inlets-Pro Server droplet deployed in Digital Ocean using inletsctl (I am using Digital Ocean but there are other options – https://docs.inlets.dev/#/?id=exit-servers)
- License file obtained from Inlets.dev, monthly or annual subscriptions
- Export TCP Ports (6443) and define upstream of local Kubernetes cluster (localhost), for Kasten K10 I also exposed 8080 which is what is used for the ingress service for the multi-cluster functionality.
- curl -k https://Inlets-ProServerPublicIPAddress:6443
- Update KUBECONFIG to access through websocket from the internet
Deploying your exit-server
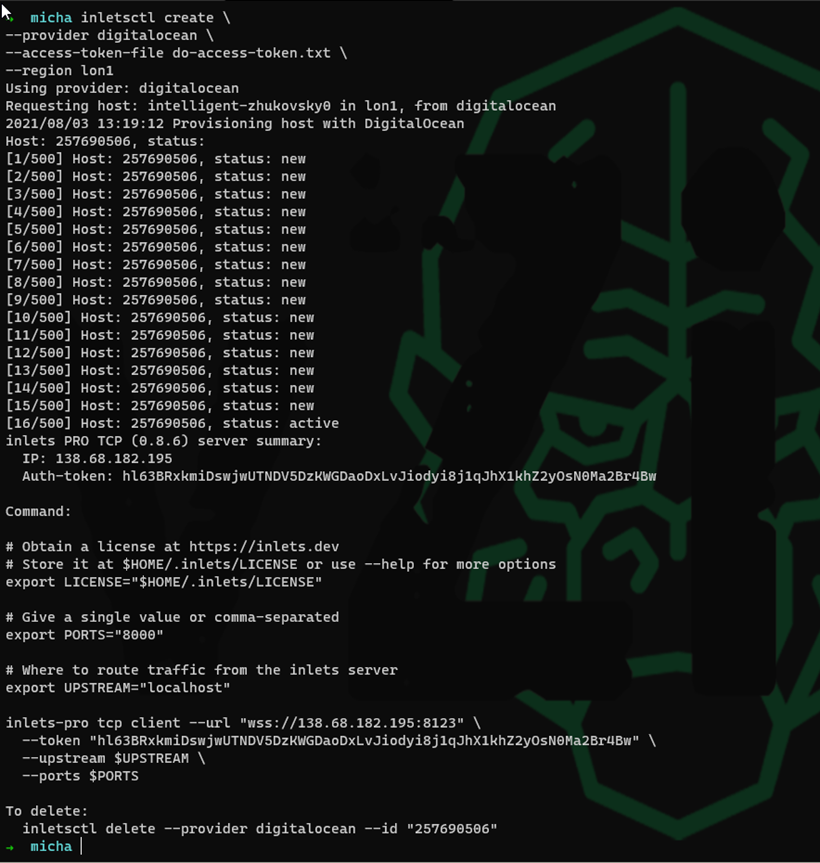
I used Arkade to install my inletscli more can be found here. The first step once you have the cli is to get your exit server deployed. I created a droplet in Digital Ocean to act as our exit server, could be many other locations as mentioned and shown in the link above. The following command is what I used to get my exit-server created.
inletsctl create \
--provider digitalocean \
--access-token-file do-access-token.txt \
--region lon1
Define Ports and Local (Dark Network IP)
You can see from the above screen shot that the tool also gives you handy tips on what commands you now need to run to configure your inlets pro exit-server within Digital Ocean. We now have to define our ports which for us will be 6443 (Kubernetes API) and 8080 (Kasten K10 Ingress) we also need to define the IP address on our local network.
export TCP_PORTS="6443,8080" - Kubernetes API Server
export UPSTREAM="localhost" - My local network address for ease localhost works.

inlets-pro tcp client --url "wss://209.97.177.194:8123" \
 --token "S8Qdc8j5PxoMZ9GVajqzbDxsCn8maxfAaonKv4DuraUt27koXIgM0bnpnUMwQl6t" \
 --upstream $UPSTREAM \
 --ports $TCP_PORTS \
 --license "$LICENSE"
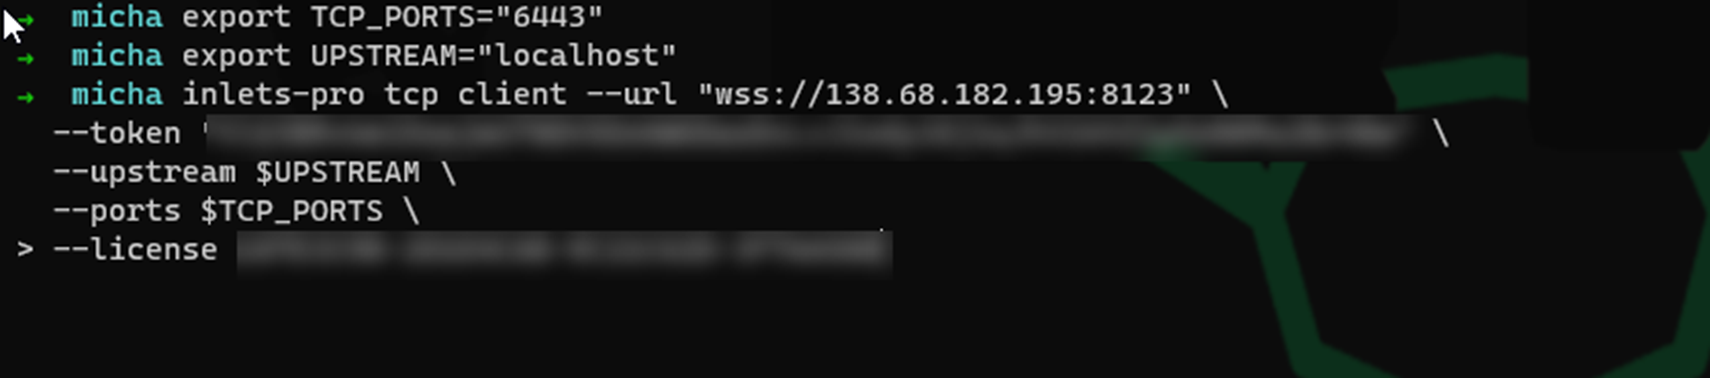 Image note – I had to go back and add export TCP_PORTS=”6443, 8080″ for the kasten dashboard to be exposed
Secure WebSocket is now established
When you commit the commands above to configure inlets-PRO you will then have the following if configured correctly, leave this open in a terminal this is the connection between the exit-server and your local network.

Confirm access with curl
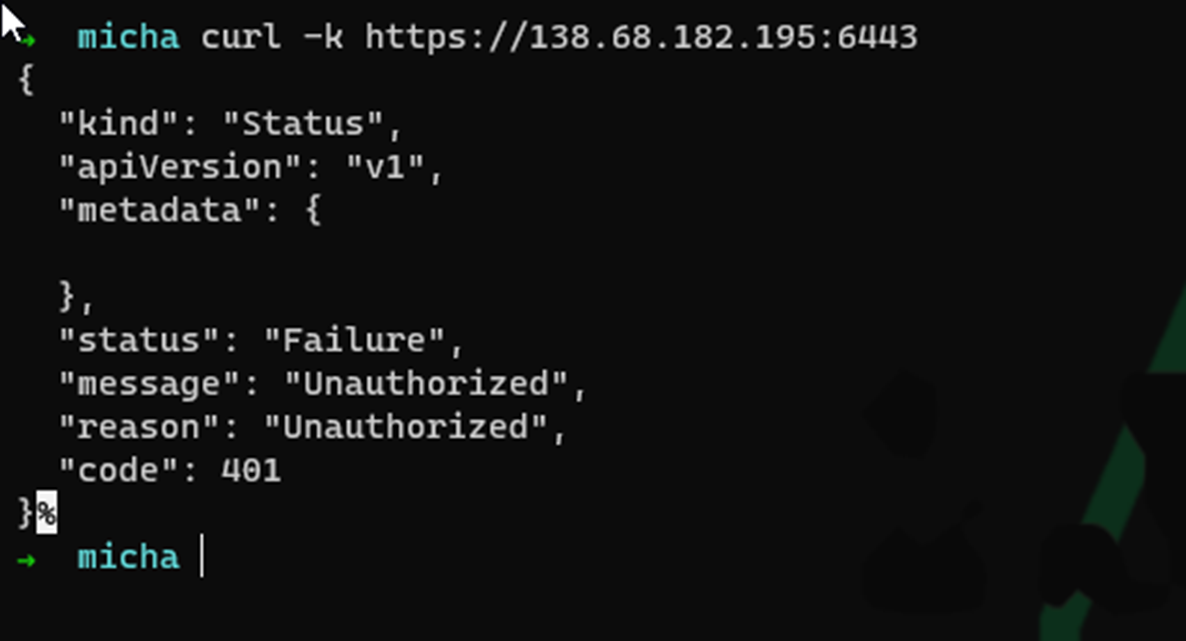
As we are using the Kubernetes API, we are not expecting a fully authorised experience via curl but it does show you have external connectivity with the following command.
curl -k https://178.128.38.160:6443
Updating KubeConfig with Public IP
We already had our KUBECONFIG for our local K3D deployment, to create my cluster I used the following command for the record. If you do not suggest the API port as 6443 then some high random port will be used which will skew everything we have done at this stage.
k3d cluster create darksite --api-port 0.0.0.0:6443
Anyway, back to updating the kubeconfig file, you will have the following in there currently which is fine for access locally inside the same host.
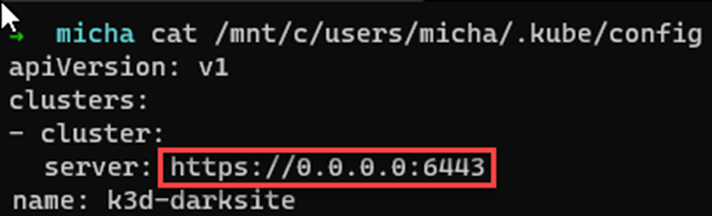
Make that change with the public facing IP of the exit-server

Then locally you can confirm you still have access

Overview of Inlets configuration
Now we have a secure WebSocket configured and we have access externally to our hidden or dark Kubernetes cluster, You can see below how this looks.
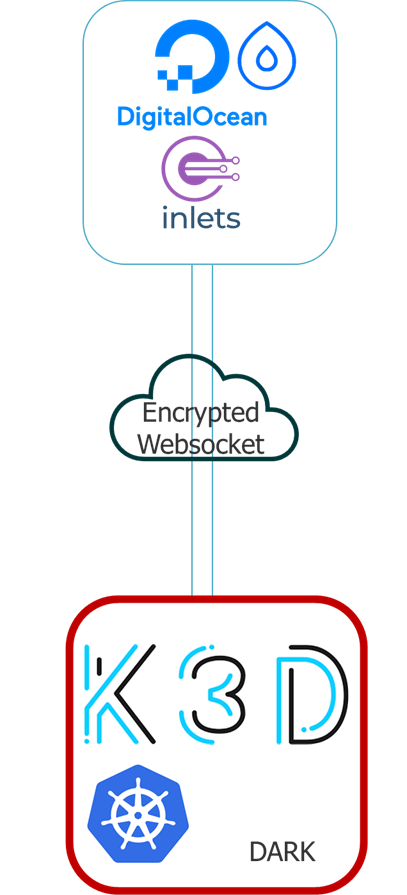
At this stage we can share the KUBECONFIG file, and we have shared access to our K3D cluster within our private network.
I am going to end this post here, and then the next post we will cover how I then went to configure Kasten K10 multi cluster so that now I can manage my two CIVO clusters and my K3D clusters from a data management perspective using Inlets to provide that secure WebSocket.
]]>I will say here that the continuation of “this is not that hard” is still the case and if anything and as probably expected when you start looking into managed services. Don’t get me wrong I am sure if you are running multiple clusters and hundreds of nodes that might change that perception I have although the premise is still the same.
Pre-requisites
I am running everything on a Windows OS machine, as you can imagine though everything we talk about can be run on Linux, macOS and of course Windows. In some places, it can also be run in a docker container.
AWS CLI
Top of the tree is the management CLI to control all of your AWS services. Dependent on your OS you can find the instructions here.
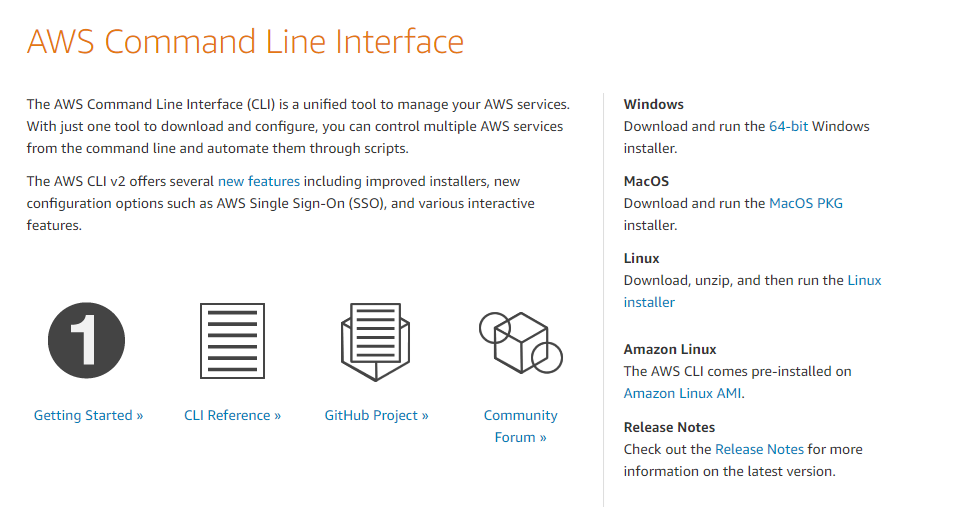
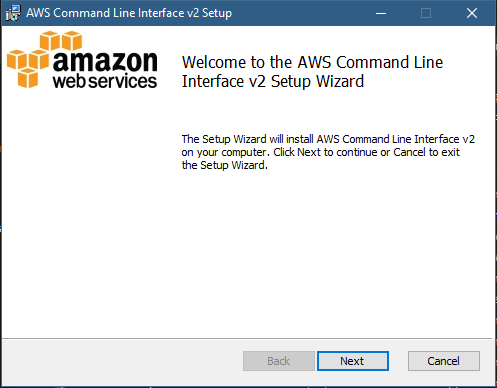
The installation is straight forward once you have the MSI downloaded. Just follow these next few steps.
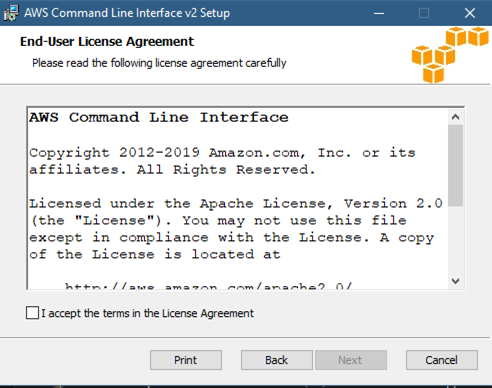
Everyone should read the license agreement. This one is a short one.
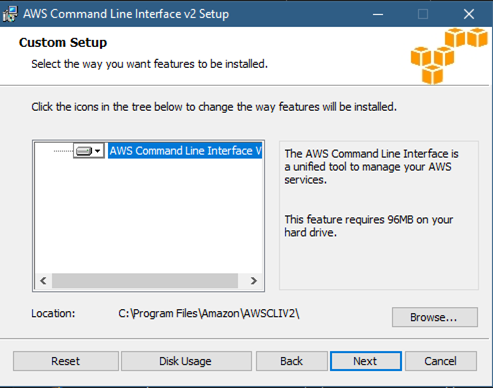
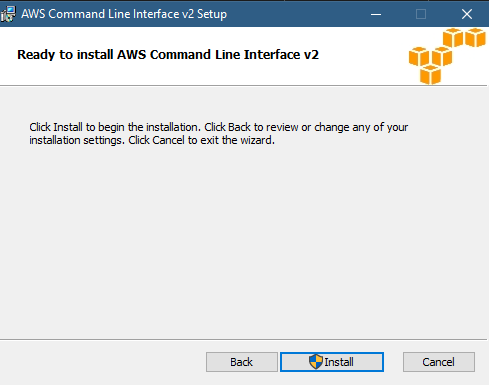
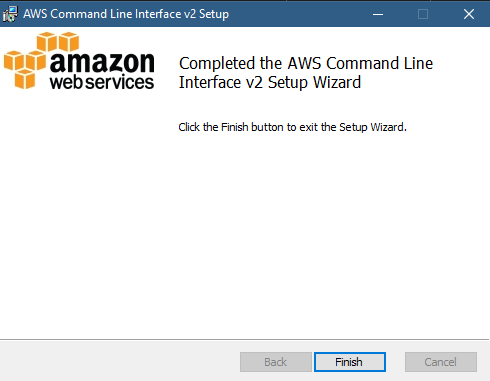
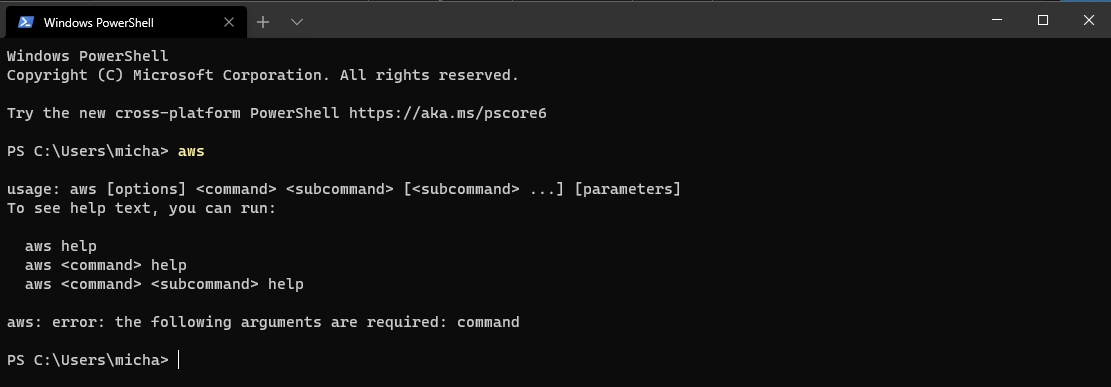
Confirm that you have installed everything successfully.
Install kubectl
The best advice here is to check here on the version to be using within AWS EKS, you need to make sure for stable working conditions that you have the supported version of kubectl installed on your workstation. If you have been playing a lot with kubectl then you may have a newer version depending on your cluster, my workstation is using v1.20.4 as you can see below. To note it is the client version you need to focus on here. The second line (“Server Version”) contains the apiserver version.
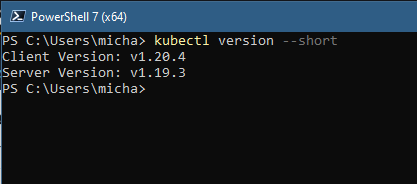
My suggestion is to grab the latest MSI here.
Install eksctl CLI
This is what we are specifically going to be using to work with our EKS cluster. Again official AWS Documentation can be found here. Again, various OS options here but we are using Windows so we will be installing eksctl using chocolatey.
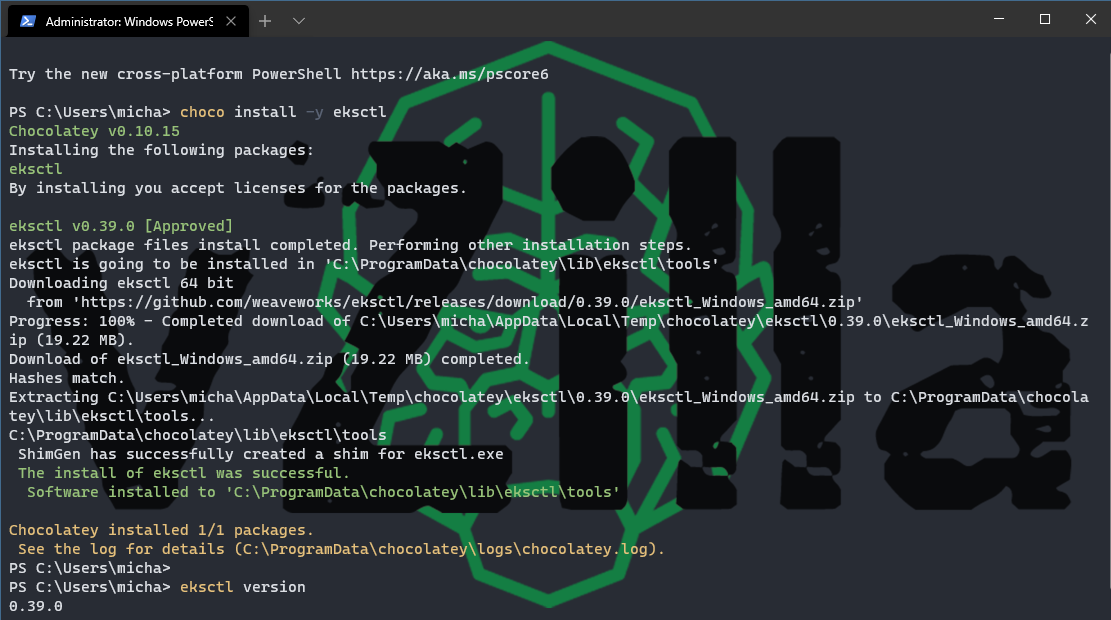
IAM & VPC
Now I am not going to cover this as this would make it a monster post but you need an IAM account with specific permissions that allow you to create and manage EKS clusters in your AWS account and you need a VPC configuration. For lab and education testing, I found this walkthrough very helpful.
Let’s get to it
Now we have our prerequisites we can begin the next easy stages of deploying our EKS cluster. We will start by configuring our workstation AWS CLI to be able to interact with our AWS IAM along with the region we wish to use.
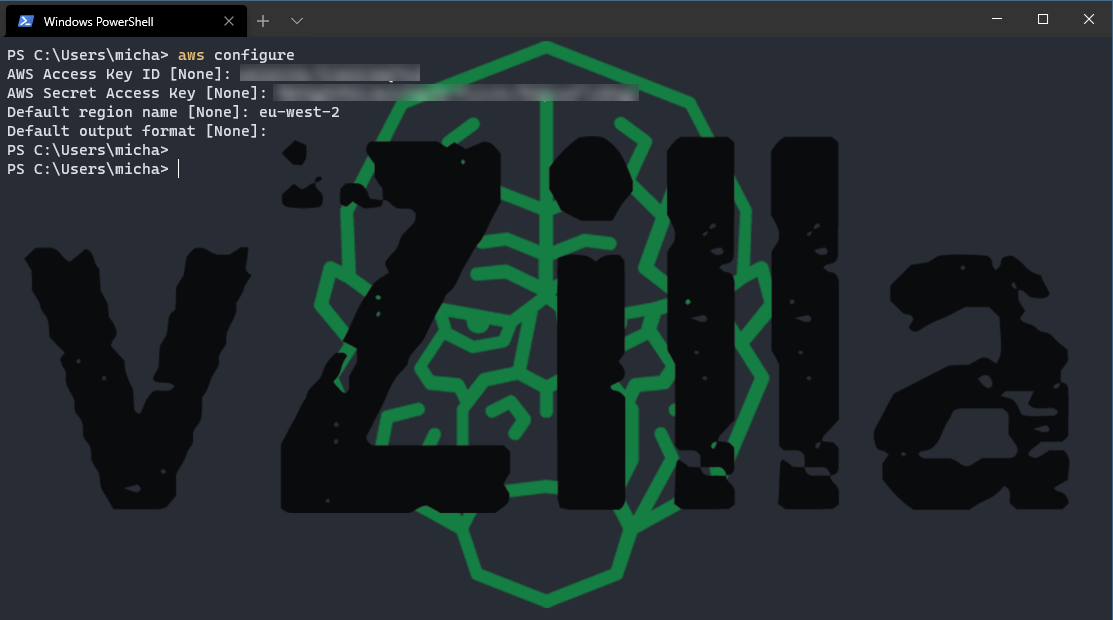
Next, we will use EKSCTL commands to build out our cluster, the following command is what I used for test purposes. Notice with this we will not have SSH access into our nodes as we did not specify this, but I will cover off the how on this later. This command will create a cluster called mc-eks in the eu-west-2 (London) region with a standard node group and it will use t3.small instances. This is my warning shot. If you do not specify a node type here it will use m5.large and for those using this for education then things will get costly. Another option here to really simplify things is to run eksctl create cluster and this will create an EKS cluster in your default region that we specified above with AWS CLI with one nodegroup with 2 of those monster nodes.
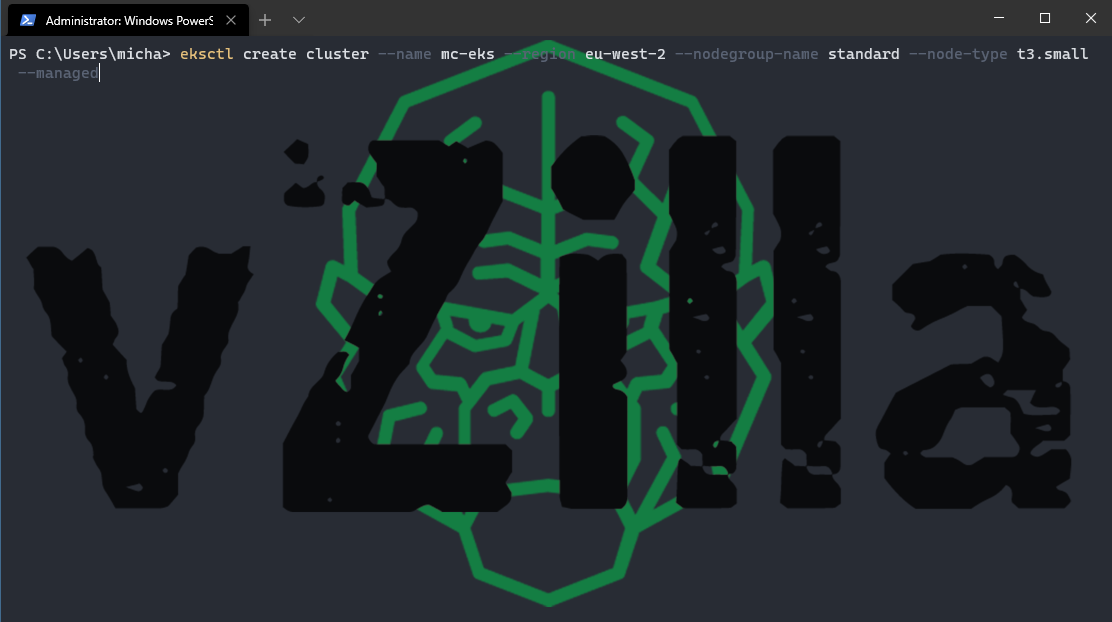
Once you are happy you have the correct command then hit enter and watch the cluster build start to commence.
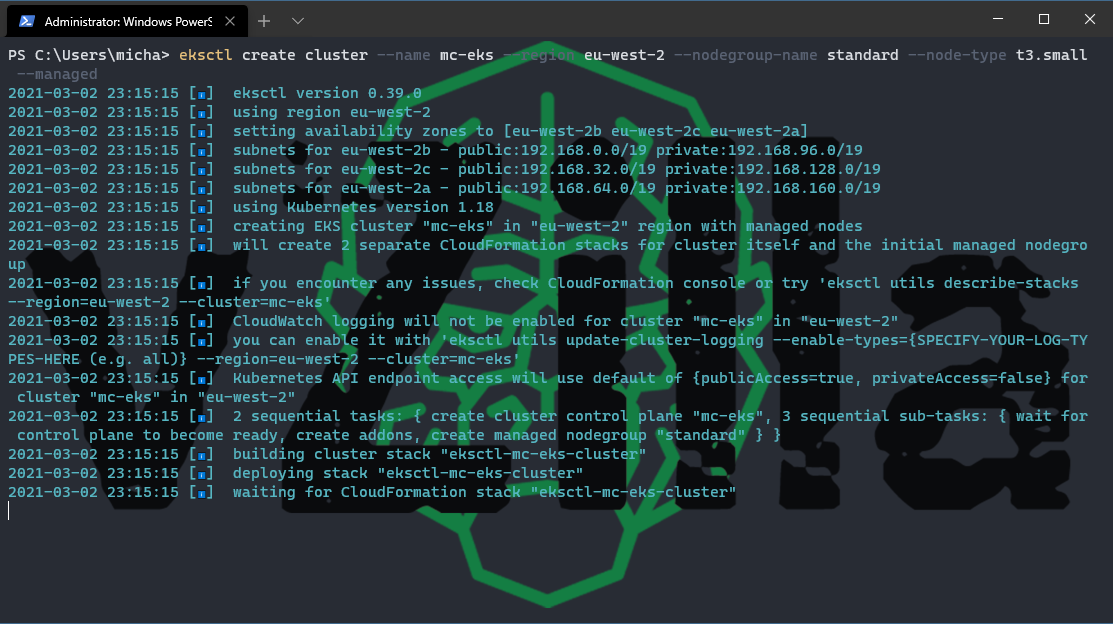
If you would like to understand what the above is then you can head into your AWS management console and location CloudFormation and here you will see the progress of your new EKS stack being created.

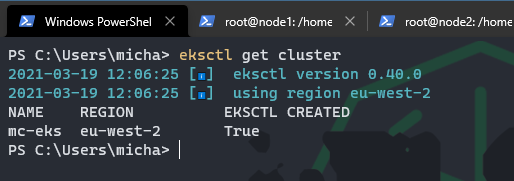
Then when this completes you will have your managed Kubernetes cluster running in AWS and accessible via your local kubectl. Because I also wanted to connect via SSH to my nodes I went with a different EKS build-out for longer-term education and plans. Here is the command that I run when I require a new EKS Cluster. To what we had above it looks similar but when I also created the IAM role I wanted the SSH key so I could connect to my nodes this is reflected in the –ssh-access being enabled and then ssh-public-key that is being used to connect. You will also notice that I am creating my cluster with 3 nodes with 1 minimum and 3 maximum. There are lots of options you can put into creating the cluster including versions
eksctl create cluster –name mc-eks –region eu-west-2 –nodegroup-name standard –managed –ssh-access –ssh-public-key=MCEKS1 –nodes 3 –nodes-min 1 –nodes-max 4
Accessing the nodes
If you did follow the above and you did get the PEM file when you created the IAM role then you can now SSH into your nodes by using a similar command to below: obviously making sure you had the correct ec2 instance and the location of your pem file.
ssh [email protected] -i C:\Users\micha\.kube\MCEKS1.pem
in order to get the public DNS name or public IP then you can run the following command, again for the note I am filtering to only show m5.large because I know this is the only instances I have running with that size ec2 instance type.
aws ec2 describe-instances –filters Name=instance-type,Values=m5.large
if these are the only machines you have running in your default region, we provided then you can just run the following command.
aws ec2 describe-instances
Accessing the Kubernetes Cluster
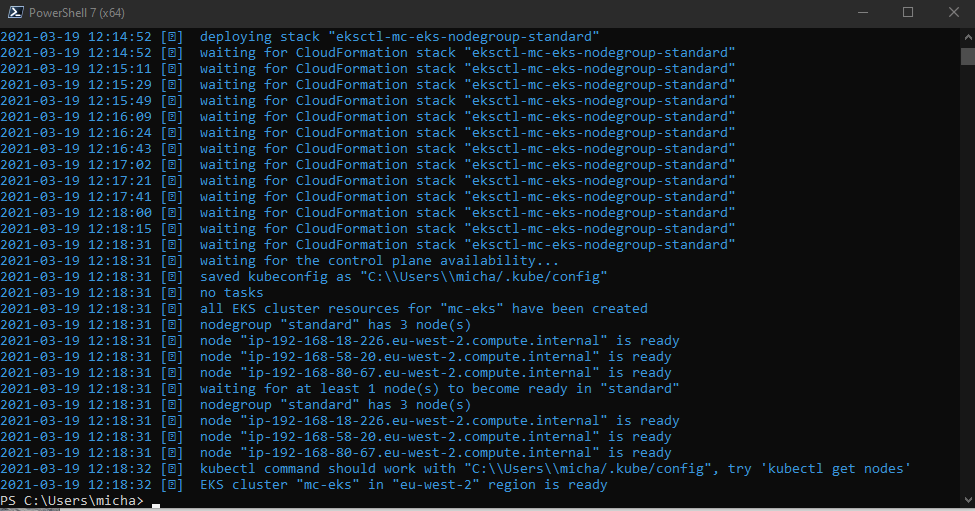
Finally we now just need to connect to our Kubernetes cluster, when you receive the end of the command we ran to create the cluster as per below
We can then check access,
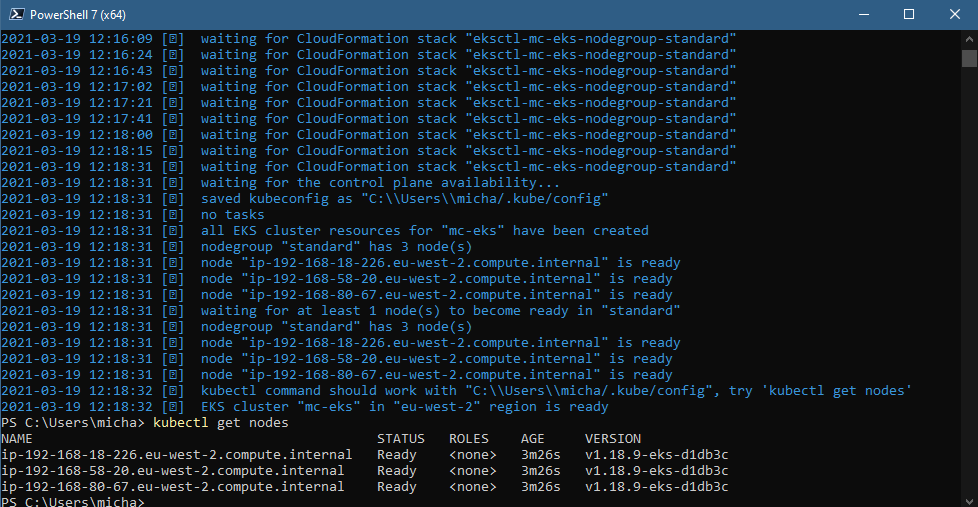
eksctl created a kubectl config file in ~/.kube or added the new cluster’s configuration within an existing config file in ~/.kube. if you already had say a home lab in your kubectl config then you can see this or switch to this using the following commands. Also covered in a previous post about contexts.
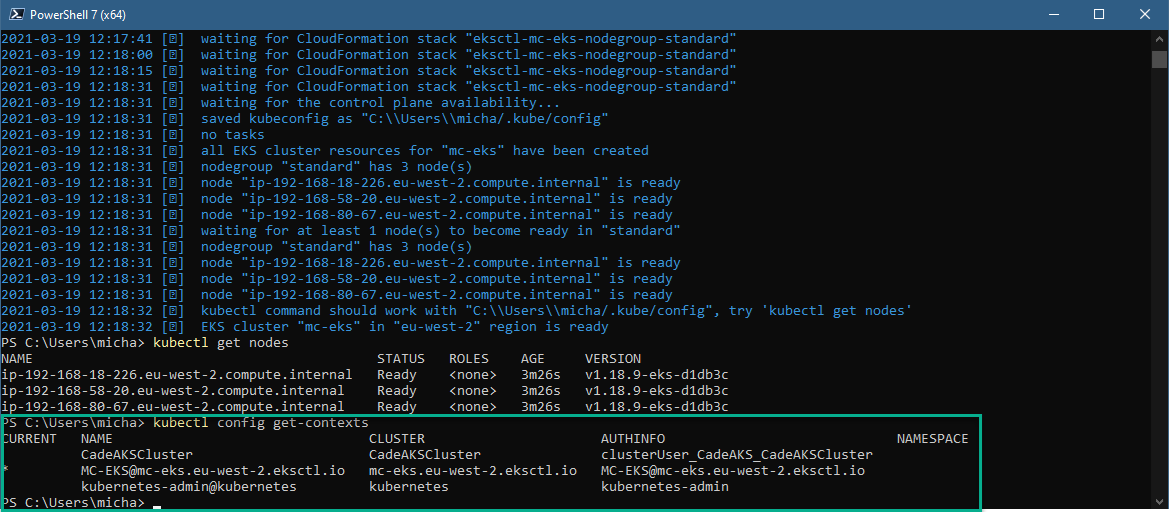
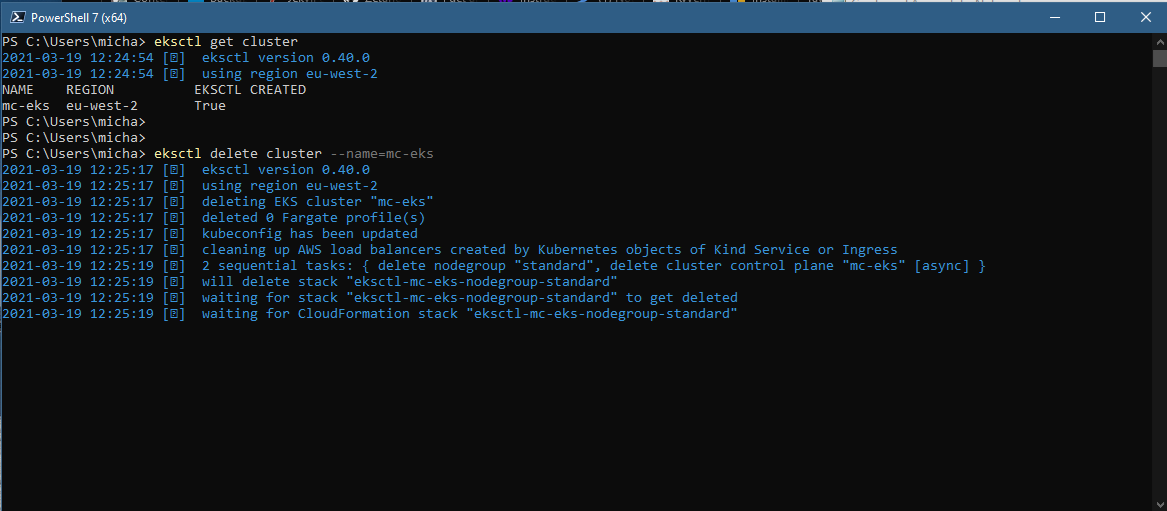
The final thing to note is, obviously this is costing you money whilst this is running so my advice is to get quick at deploying and destroying this cluster, use it for what you want and need to learn and then destroy it. This is why I still have a Kubernetes cluster available at home that costs me nothing other than it is available to me.
Hopefully, this will be useful to someone, as always open for feedback and if I am doing something not quite right then I am fine also to be educated and open to the community to help us all learn.
]]>
This post will wrap up the 10-part series of getting started on my hands-on learning journey of Kubernetes, the idea here was to try and touch on a lot of the areas without going through the theory in these posts. A lot of theory I have picked up through various learning assets that I have listed here. In the previous posts we have gone into creating a platform for our Kubernetes cluster to run on, we have touched on various stateless and stateful applications, load balancers and object storage amongst a few more topics to get going and started. We have only touched the surface of this whole entire topic though and I fully intend to continue to document further on about the public cloud and managed Kubernetes services that are available.
In this post we are going to wrap the series up talking about data management, what better way to attack this than to cover the installation and deployment of K10 in our lab to assist us with our lab backups and more, the more we can get into over another series and potential video series. But after spending the time getting up and running you will want to spin up and down that cluster and it might then make sense to store some backups to get things back but at least have that data protection angle in the back of your mind as we all navigate this new world.
Everything Free
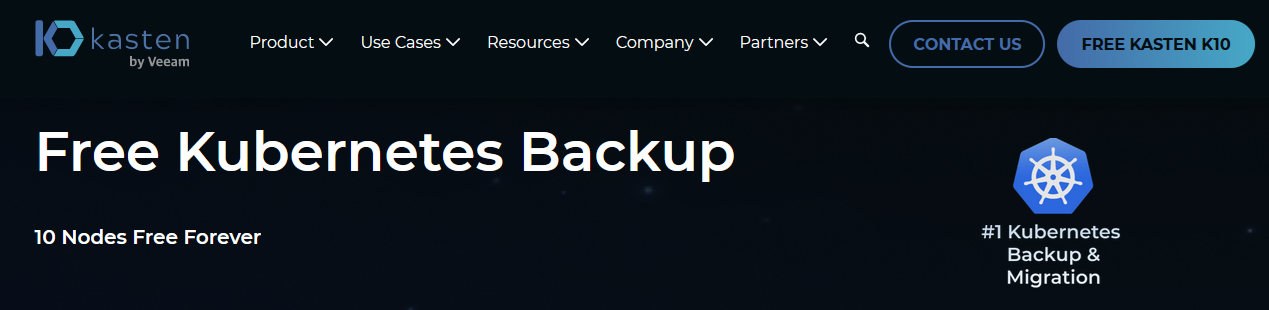
First of all, everything so far in the series has been leveraging free tools and products, so we continue that here with Kasten K10 free edition. There are a few ways in fact you can take advantage of this free edition, firstly its going to cover you for 10 worker nodes and its free forever! This is ideal for testing and home lab learning scenarios where a lot of us are now. This is a mantra that has been the case at Veeam for a long time. There is always a free tier available with Veeam software. How do you get started, well on the page above and both topics needs to be covered off more in another post but you have the test drive option which enables you to not have to have any home lab or cloud access to a Kubernetes cluster this will walk you through the easy approach of getting Kasten K10 up and running in a hands on lab type environment, the second is the free edition which can be obtained from cloud based marketplaces. I have also written about this in one of my opening blogs for Kasten by Veeam.
Documentation
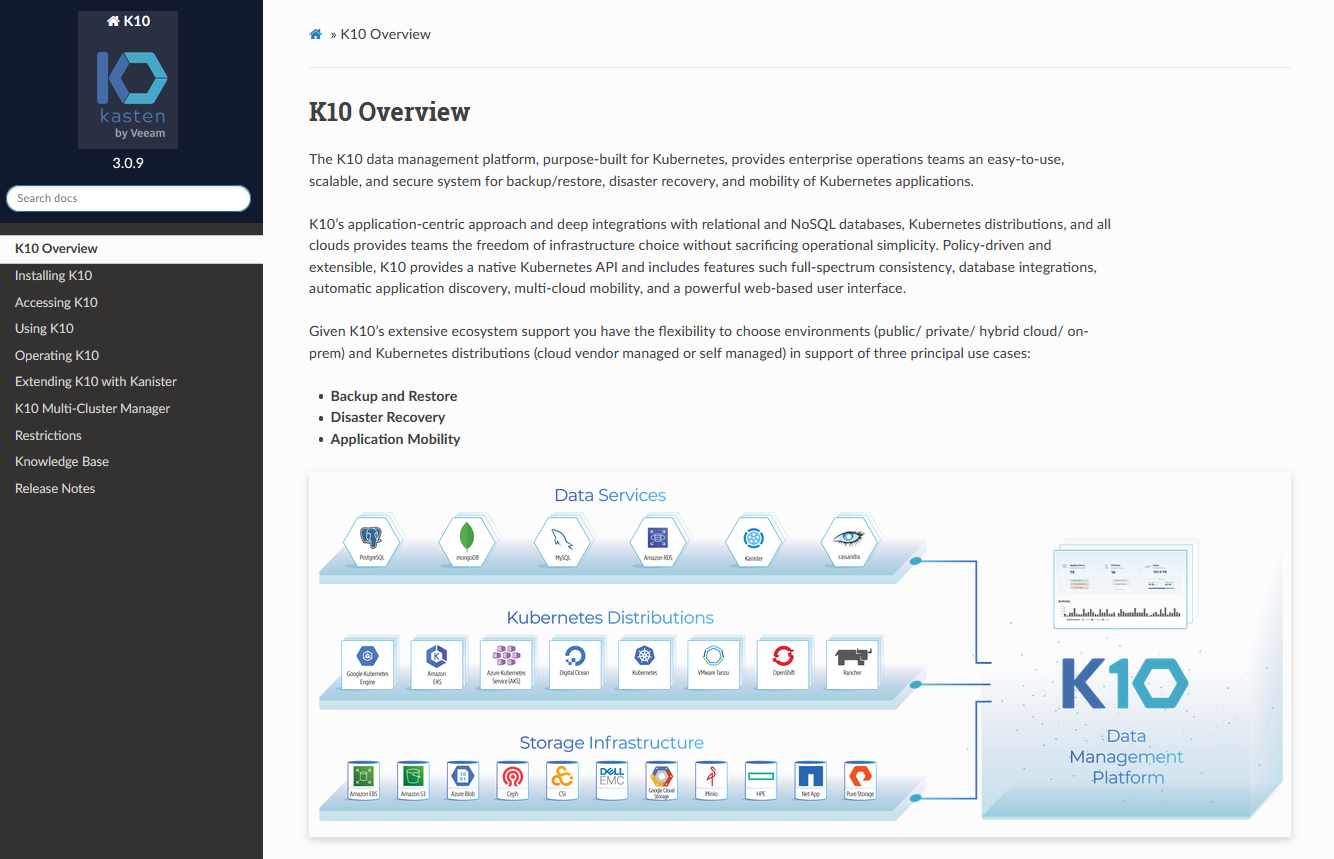
Another thing I have found is that the Kasten K10 documentation is good and thorough. Don’t worry its not thorough because its hard but it details the install options and process for each of the well known Kubernetes deployments and platforms that you are using and then into specific details that you may want to consider from a home lab user through to the enterprise paid for product that includes the same functionality but with added enterprise support and a more custom node count. You can find the link to the documentation here. Which is where the steps I am going to run through ultimately come from.
Let’s get deploying
First, we need to create a new namespace.
kubectl create namespace kasten-io
we also need to add the helm repo for Kasten K10. We can do this by running the following command.
helm repo add kasten https://charts.kasten.io/
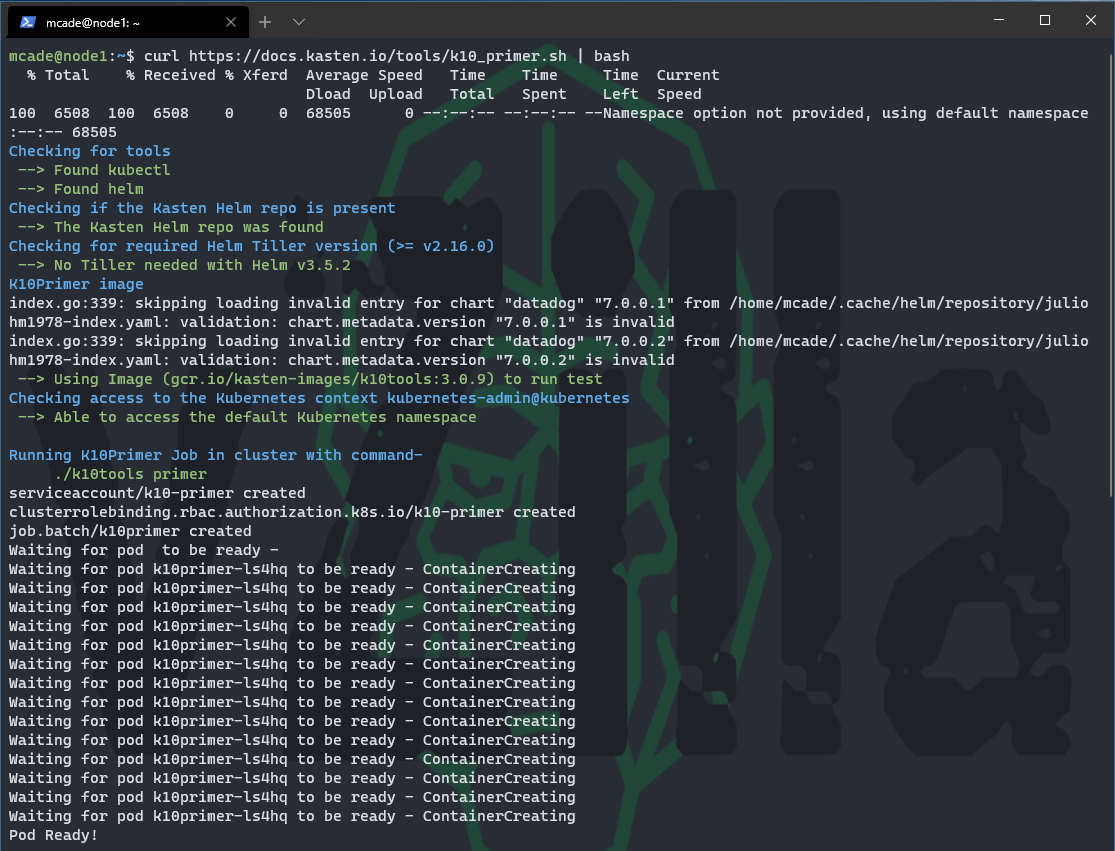
We should then run a pre flight check on our cluster to make sure the environment is going to be able to host the K10 application and be able to perform backups against our applications. This is documented under Pre-Flight checks, this will create and clean up a number of objects to confirm everything will run when we come to install K10 later on.
curl https://docs.kasten.io/tools/k10_primer.sh | bash
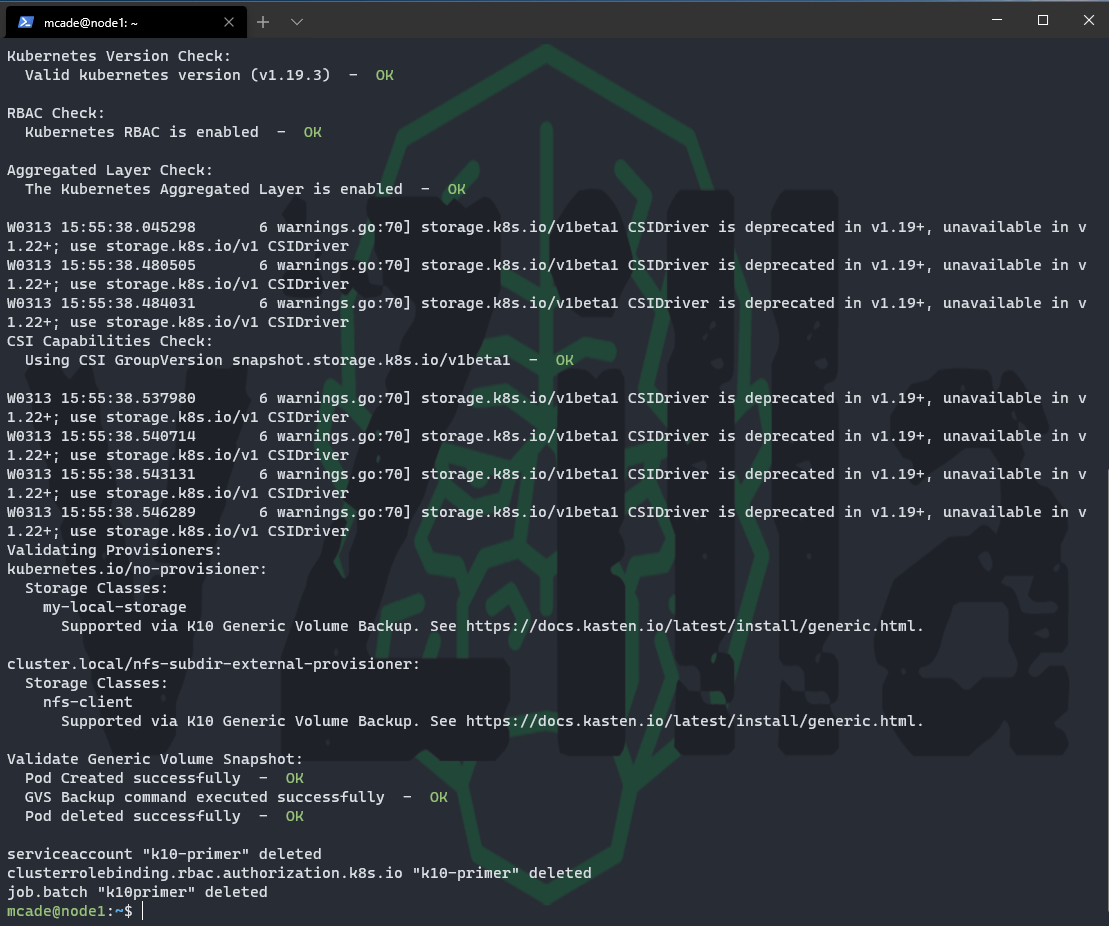
this command should look something like the following when you run it. This is going to check for access to your Kubernetes cluster by using kubectl, access to helm for deployment that we covered in a previous post as well. Validates if the Kubernetes settings meet the K10 requirements.
Continued
Installing K10
If the above did not come back with errors or warnings, then we can continue to install Kasten K10 into our cluster. This command will be leveraging the MetalLB load balancer that we covered in a previous post to give us network access to the K10 dashboard later on, you could also here use a port forward to gain access which is the default action without the additional externalGateway option in the following helm command.
helm install k10 kasten/k10 –namespace=kasten-io \
–set externalGateway.create=true \
–set auth.tokenAuth.enabled=true
Once this is complete you can watch the pods being created and, in the end, when everything has completed successfully you will be able to run the following command to see the status of our namespace.
kubectl get all -n Kasten-io
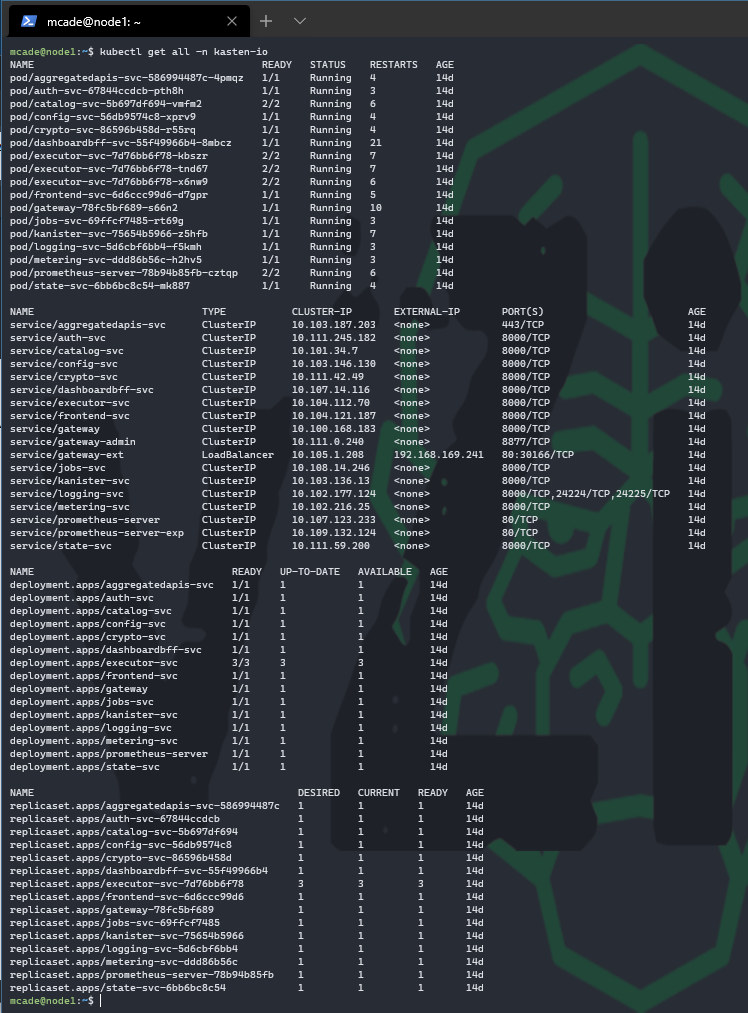
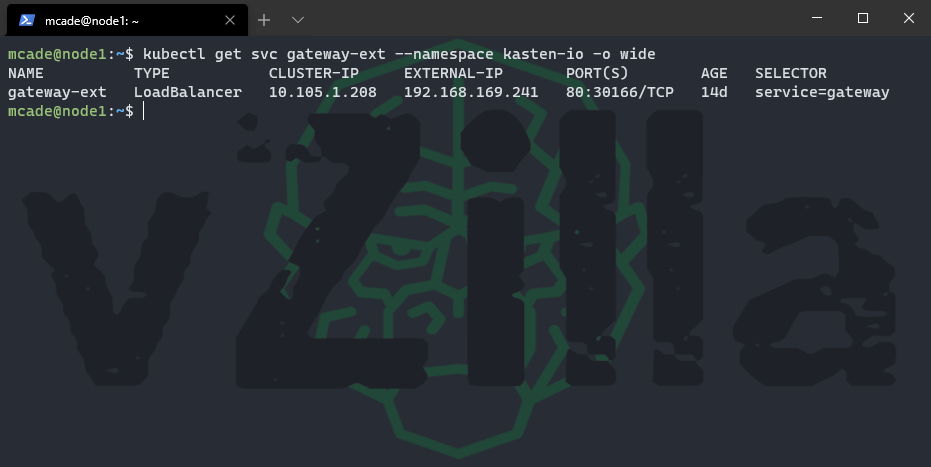
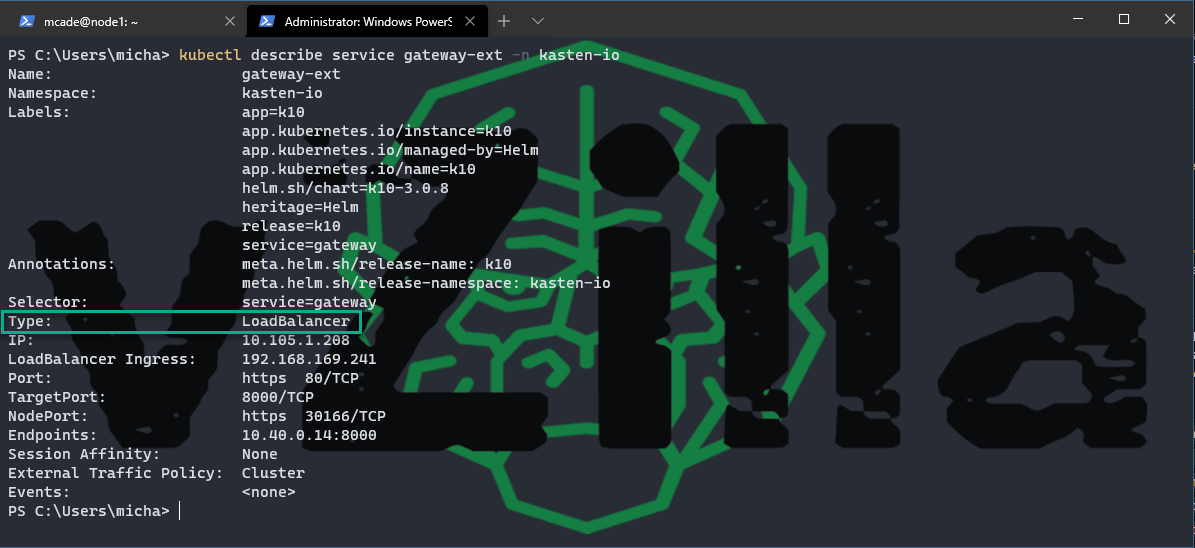
You will see from the above that we have an External IP on one of our services, service/gateway-ext should with our configuration be using LoadBalancer type and should have a value that you configured in MetalLB that you can access on your network. If you are running this on the public cloud offerings this will be using the load balancing native capabilities and will also give you an external facing value. Depending on your configuration in the public cloud you may or may not have to make further changes to enable access to the K10 dashboard. Something else we will cover in a later post.
Upgrading K10
Before we move on, we also wanted to cover, upgrades again in more detail later but every two weeks there is an update release available so being able to run this upgrade to stay up to date with new enhancements is important. The following command will enable this quick and easy upgrade.
helm upgrade k10 kasten/k10 –namespace=kasten-io \
–reuse-values \
–set externalGateway.create=true \
–set auth.tokenAuth.enabled=true
Accessing the K10 Dashboard
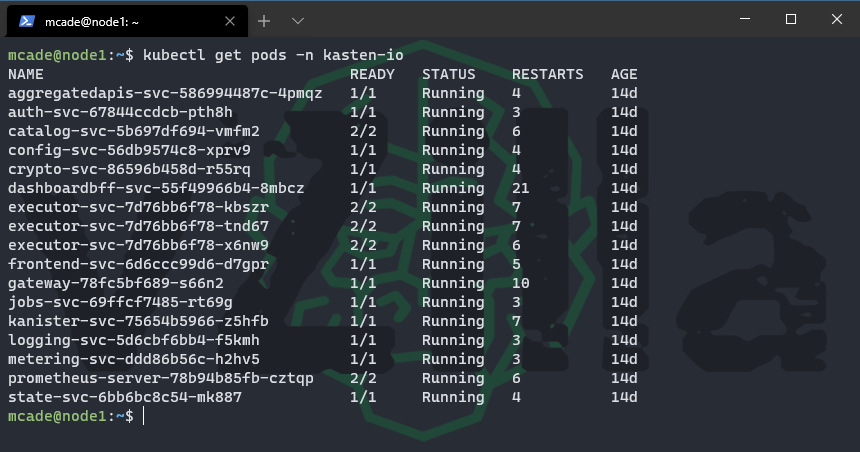
We have confirmed above the services and pods are all up and running but if we wanted to confirm this again we can do so with the following commands.
Confirm all pods are running
kubectl get pods -n kasten-io
Confirm your IP address for dashboard access
kubectl get svc gateway-ext –namespace kasten-io -o wide
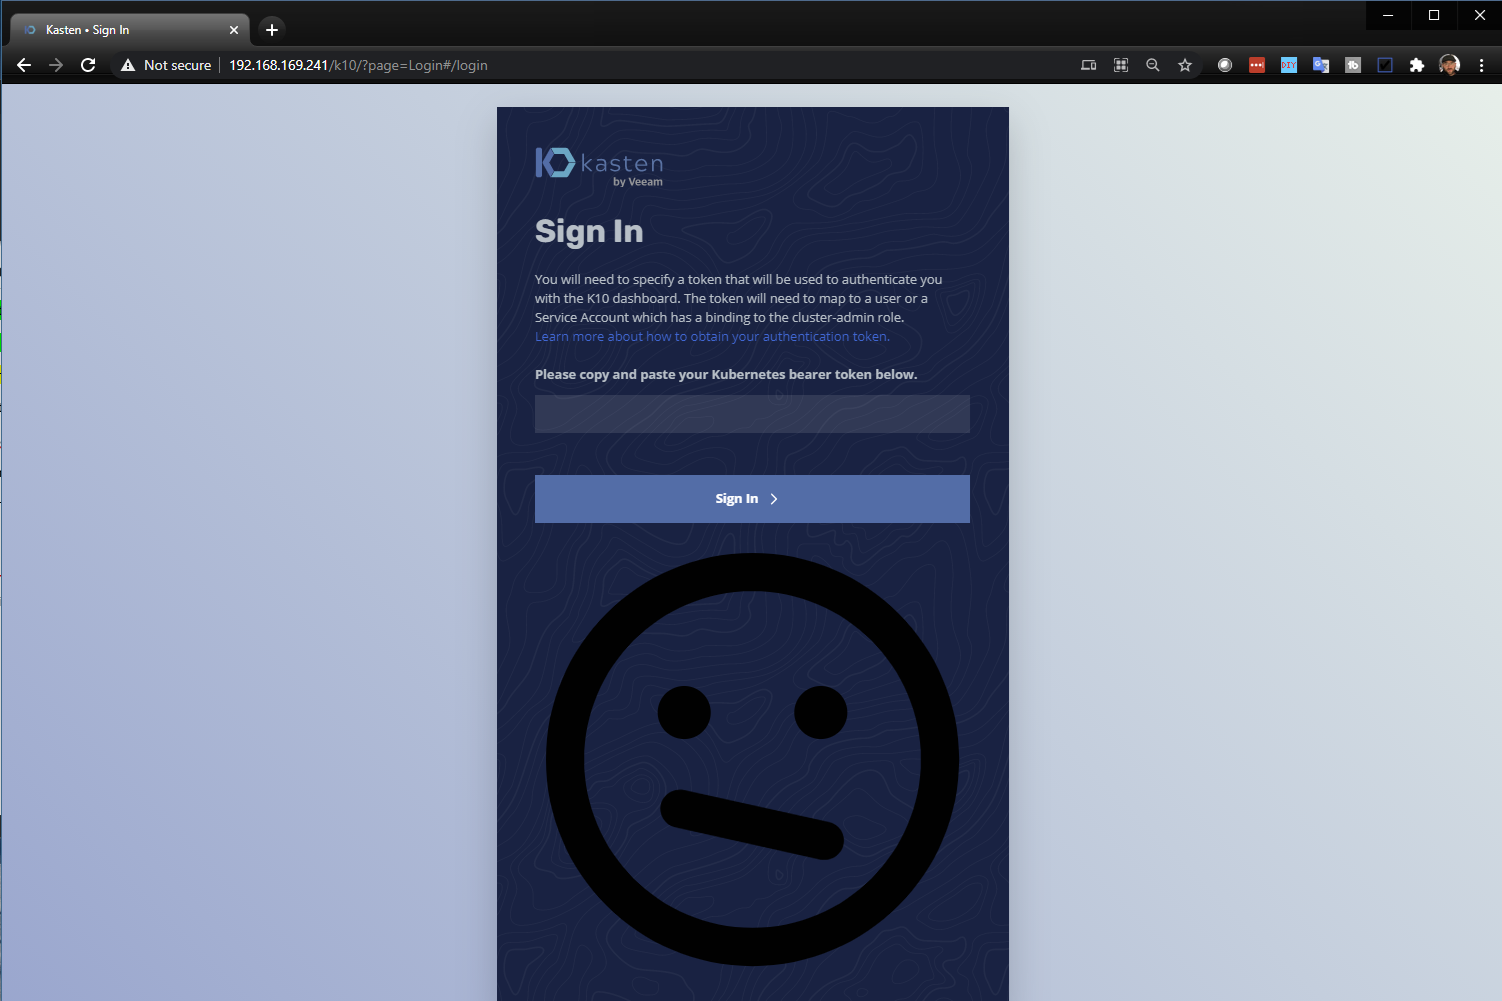
Take the external IP listed above and put this into your web browser adding it like the following, http://192.168.169.241/k10/# you will be greeted with the following sign in and token authentication request.
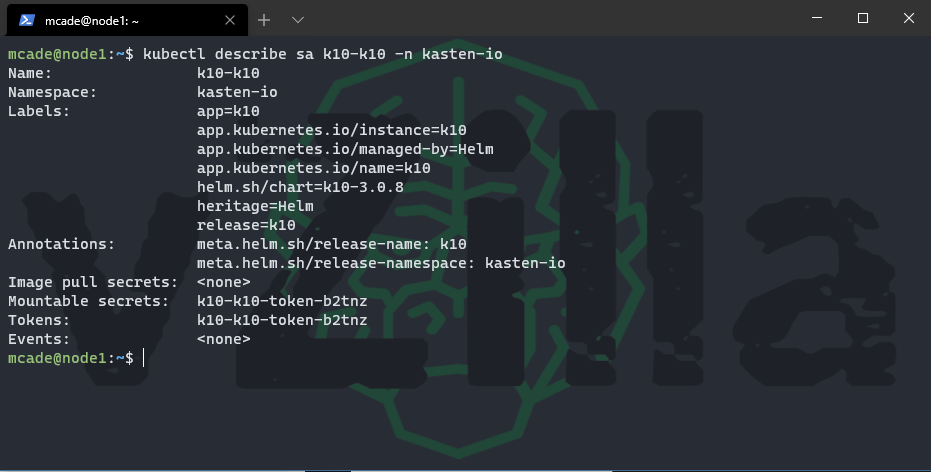
To obtain that token run the following command, this is the default service account that is created with the deployment. If you require further RBAC configuration then refer to the documentation listed above.
kubectl describe sa k10-k10 -n kasten-io
kubectl describe secret k10-k10-token-b2tnz -n kasten-io
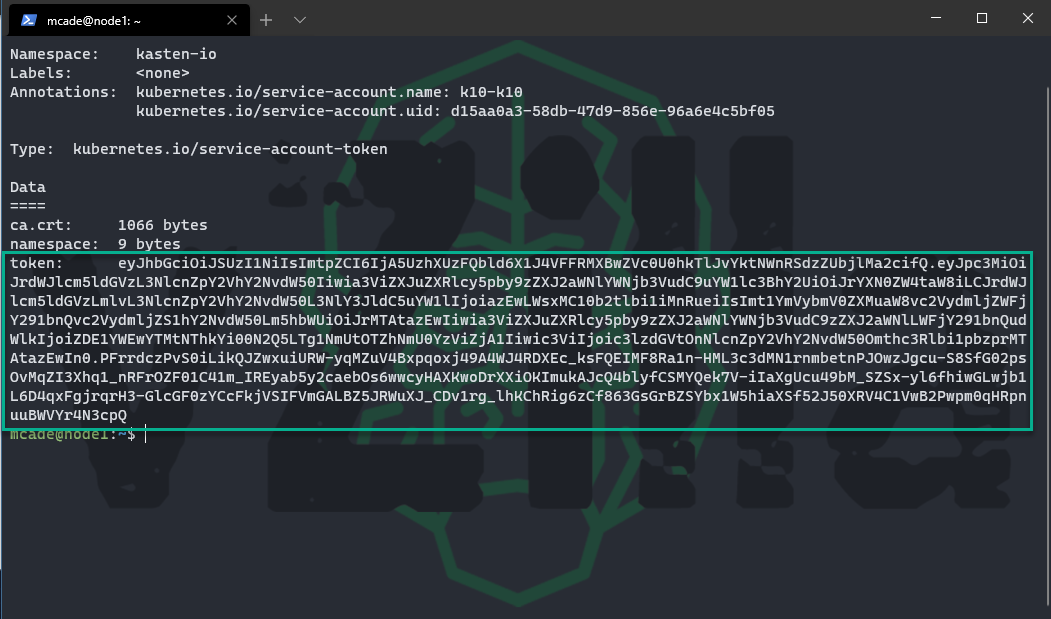
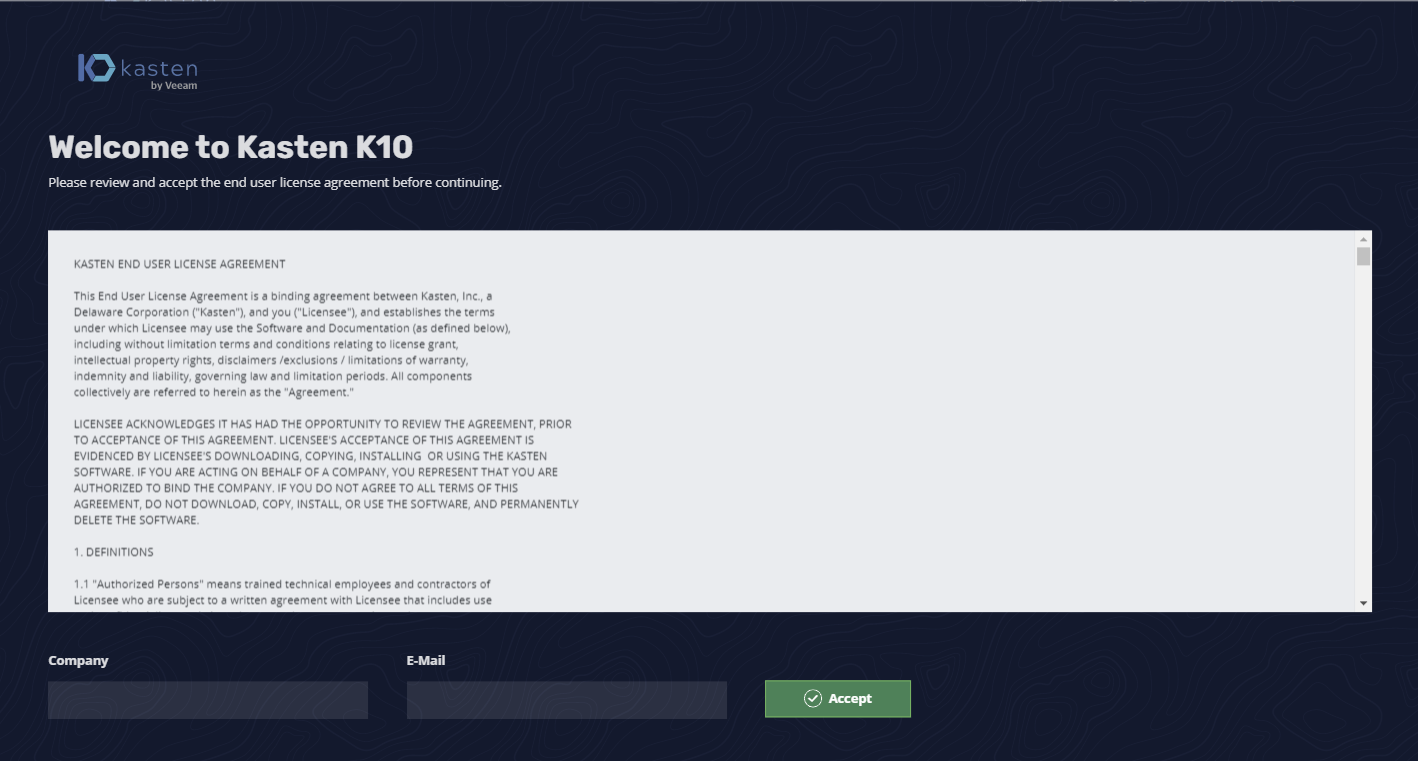
Use the above token to authenticate and then you will be greeted with the EULA, fill in the details, obviously read all the agreement at least twice and then click accept.
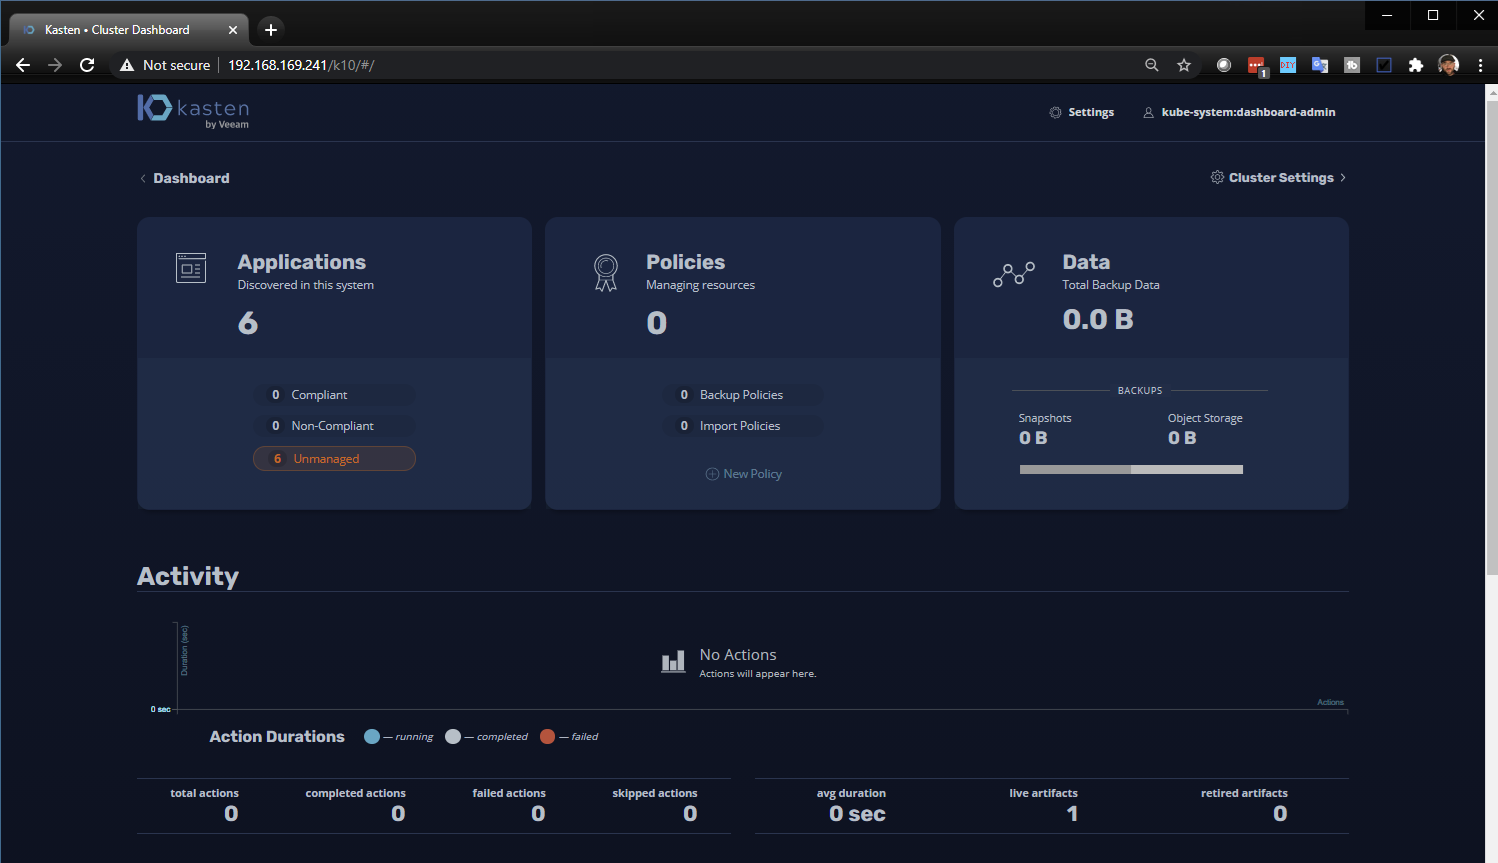
You will then see your Kasten K10 Cluster Dashboard where you can see your available Applications, Policies and what backups (snapshots) and exports (backups) you have with then a summary and overview of the jobs that have ran down below.
The next series of posts are going to continue the theme of learning Kubernetes and we will get back to the K10 journey also as we will want and need this as we continue to test out more and more stateful workloads that then require that backup functionality but also there is a lot of other cool tech and features within this product which is the same product regardless of it being free or the enterprise edition.
Hope the series was useful, any feedback would be greatly appreciated. Let me know if it has helped or not as well.
]]>
The last post was to focus a little more on applications but not so much between the stateful and stateless types of applications but in the shape of application deployment. This was deploying KubeApps and using this as an application dashboard for Kubernetes. This post is going to focus on a deployment that is firstly “mission critical” and that contains a front end and a back end.
Recently Dean and I covered this in a demo session we did at the London VMUG.
I would also like to add here that the example nodejs application and mongodb back end was first created here. Dean also has his GitHub which is where we are going to focus with the YAML files.
“Mission Critical App – Pac-Man”
Let’s start by explaining a little about our mission critical app, our application a HTML5 Pac-Man game with NodeJS as the web front end and then the back end a MongoDB database to store our high scores. You can find out more about the build up of this on the first link above.
Getting started
Over the next few sections, we will look at the building blocks to create our mission critical application. We are going to start by creating a namespace for the app.
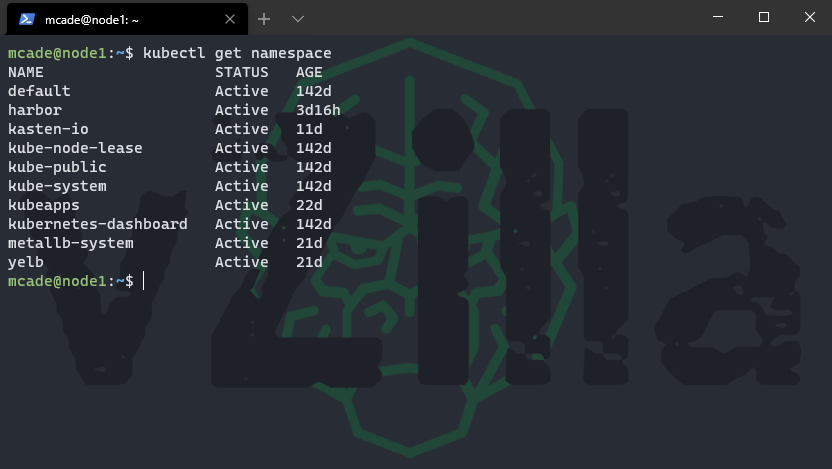
You can see here we do not have a pacman namespace
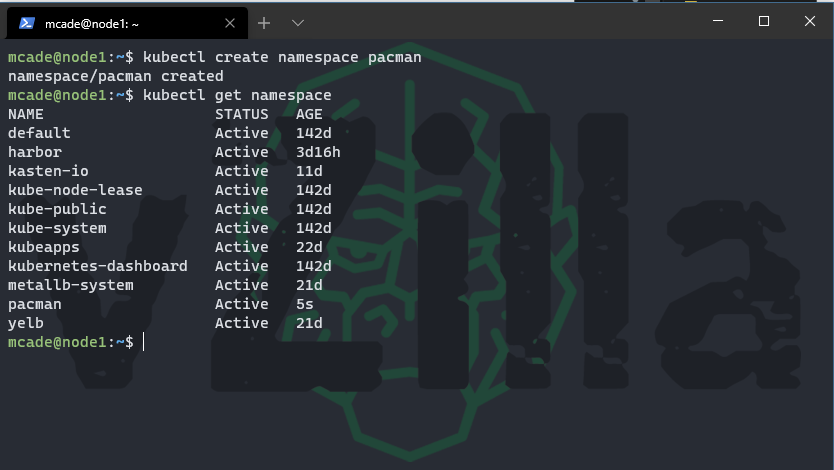
Let’s create our pacman namespace
kubectl create namespace pacman
The next stage is going to be lets download the YAML files to build out our application using the following command.
git clone https://github.com/saintdle/pacman-tanzu.git
then you could simply run each of those YAML files to get your app up and running. (one warning here to make is that you would need a load balancer in place) if you followed the MetalLB post though you will be already in a good spot.
You should now have a folder called pacman-tanzu with the following contents to get going.
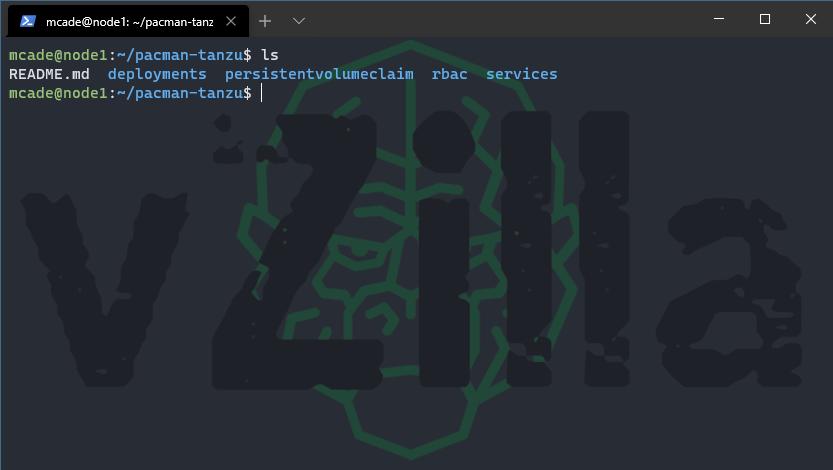
We will now take a look at those YAML files and explain a little about each one and what they do.
Deployments
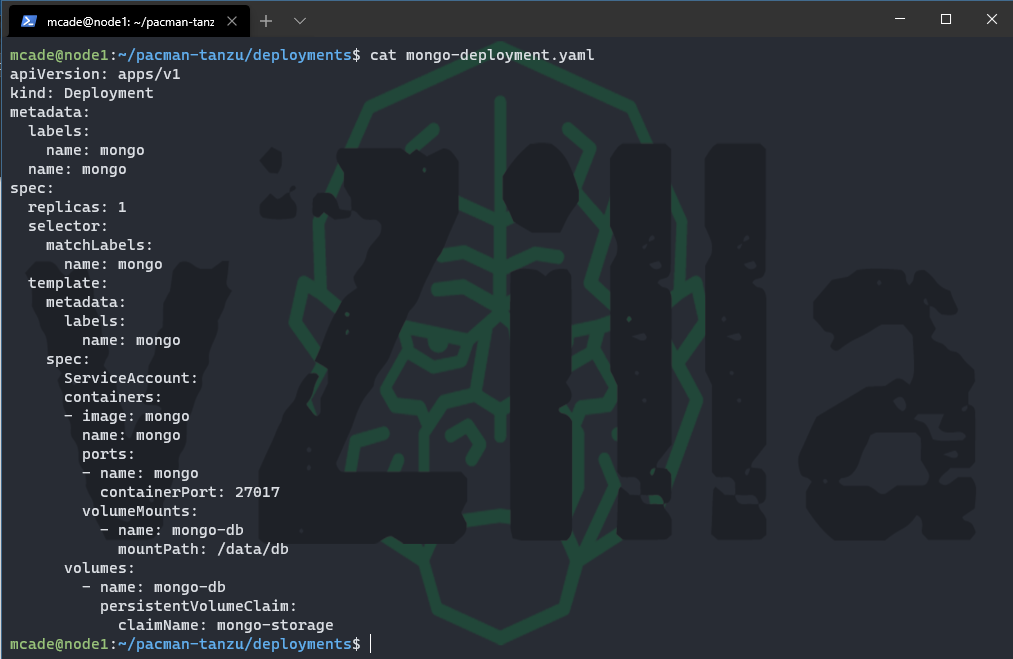
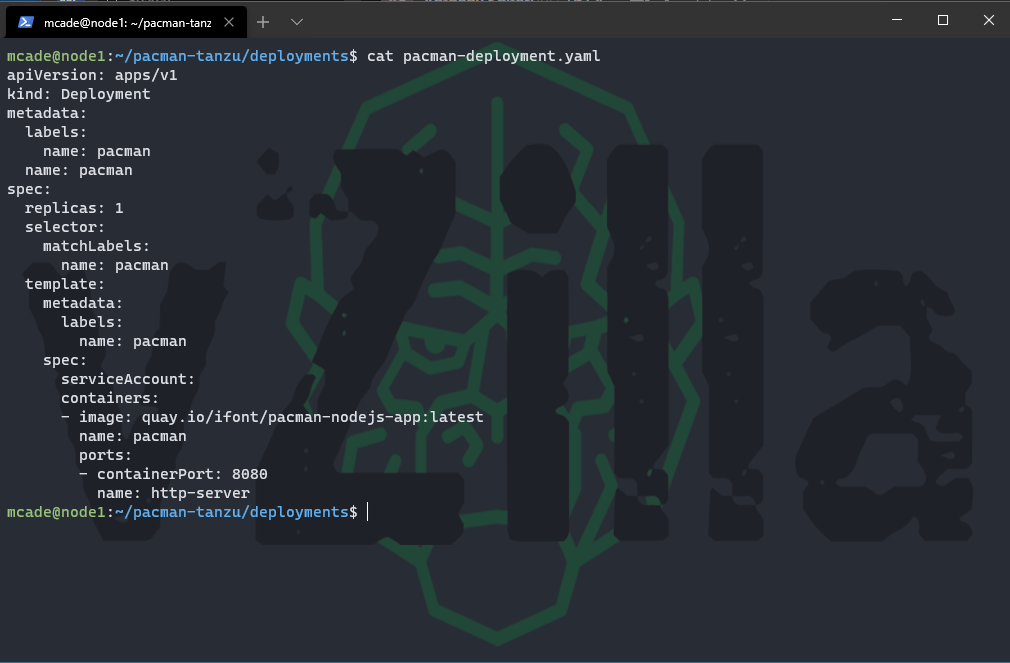
A deployment provides declarative updates for Pods and ReplicaSets. This is where we will define the Pods that we wish to deploy and how many of each pod we need. In your deployments folder you will see to files one referring to mongodb and one referring to pacman. Notice the replicaSets for both of the deployments and also that with the MongoDB deployment you will notice a persistent volume claim which we will cover later.
mongo-deployment.yaml
pacman-deployment.yaml
Persistent Volume Claim
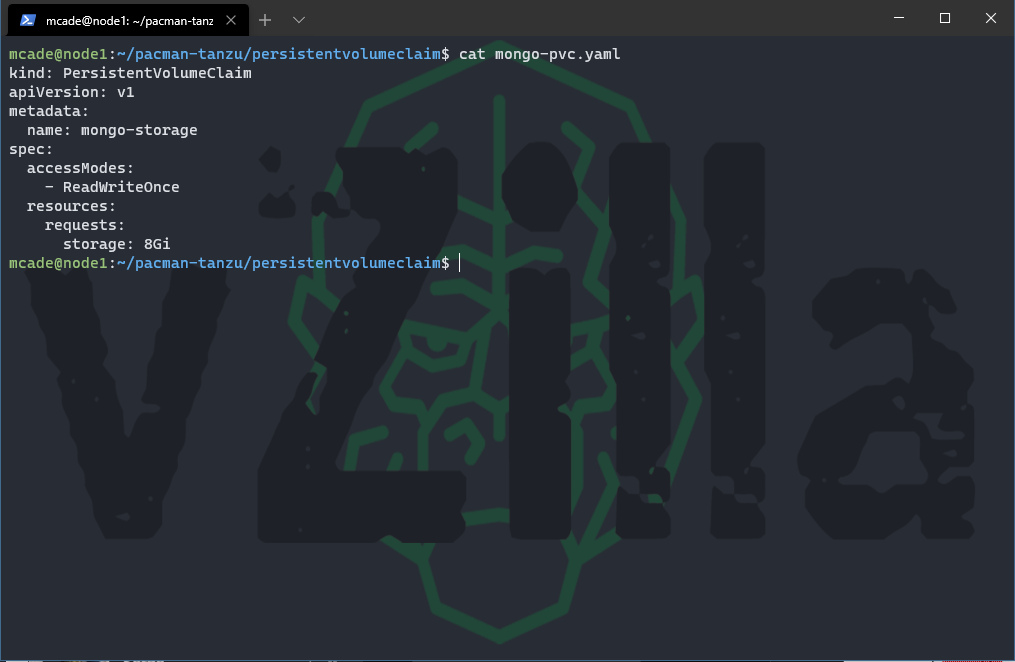
A persistent volume claim (PVC) is a request for storage, by design container storage is ephemeral and can disappear upon container deletion and creation. To provide a location where data will not be lost for our example the MongoDB we will leverage a Persistent volume outside of the container. You can find out much more about the world of storage and persistent volumes here on the official documentation.
When you download the yaml files from github it will assume that you have a default storageclass configured and ready to address persistent volume claims. The YAML file will look like the below.
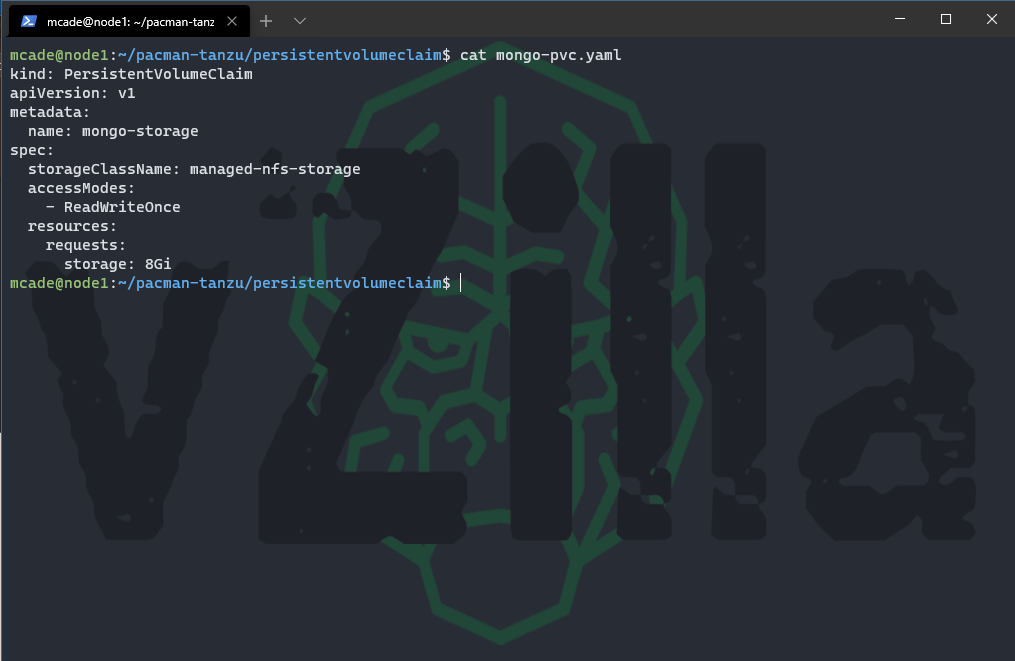
If you do not or you have multiple storage classes, you wish to use then you can define that here using the storageClassName spec.
RBAC
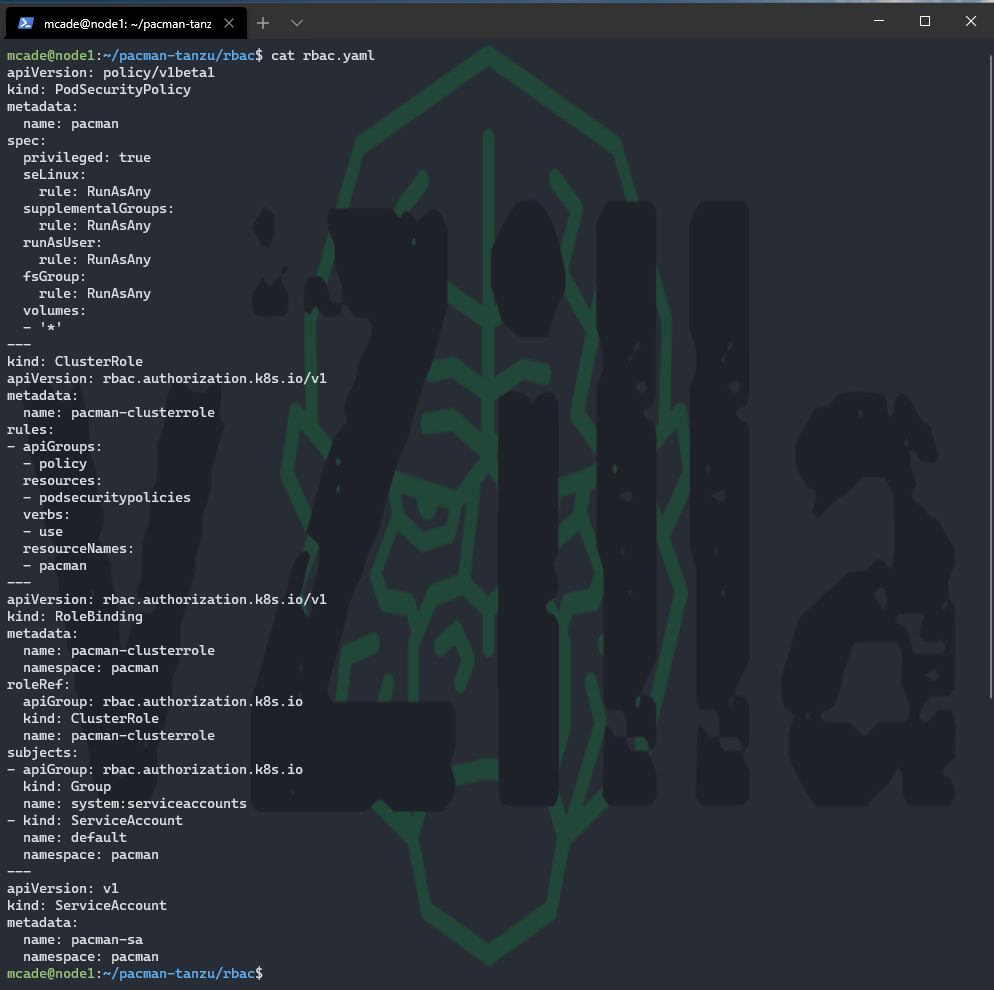
Role-based access control (RBAC) is a method of regulating access to computer or network resources based on the roles of individual users within your organization. You will see below in the YAML file that we have a ClusterRole (non namespaced) and role binding (namespaced) this is to enable connectivity between our front and back ends within the namespace. Once again more information or detailed information can be found here.
Services
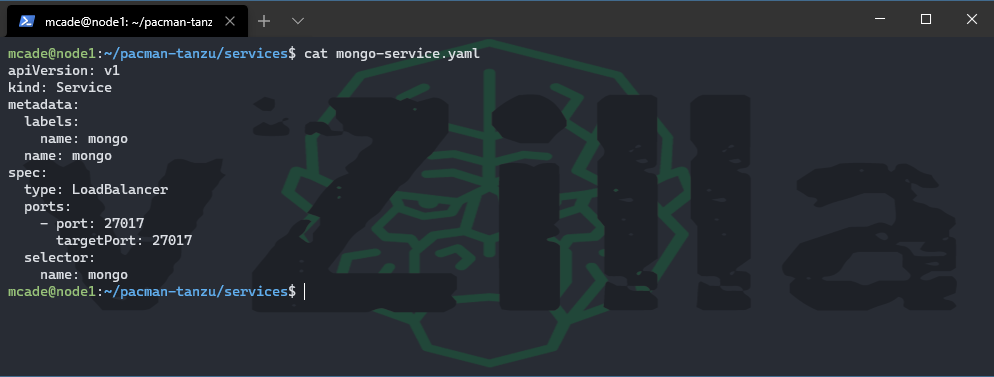
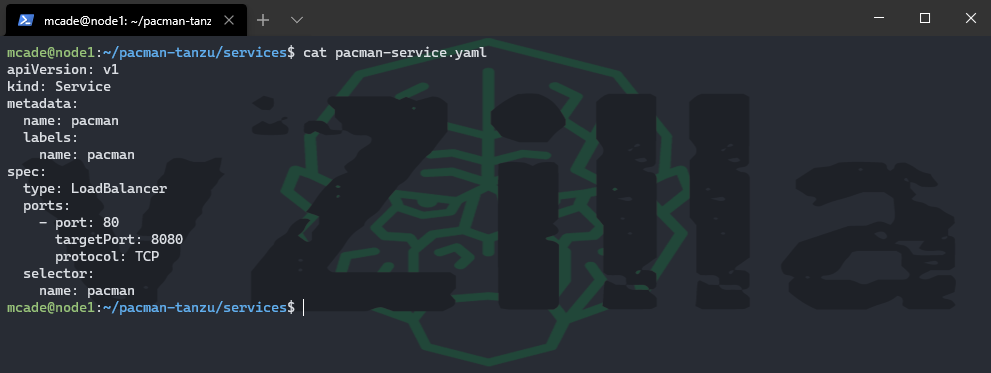
Next, we need to expose our app to the front end i.e. our uses, and we also need to bridge the gap between the pacman (front end) and the MongoDB (back end)
mongo-service.yaml
pacman-service.yaml
Ok now we have briefly explained the files we are about to run to make up our application lets go ahead and run those files. I don’t think it matters actually which order you run these in but I will be going in the order I have explained. Running the following commands will get you up and running.
kubectl create -f pacman-tanzu/deployments/mongo-deployment.yaml -n pacman
kubectl create -f pacman-tanzu/deployments/pacman-deployment.yaml -n pacman
kubectl create -f pacman-tanzu/persistentvolumeclaim/mongo-pvc.yaml -n pacman
kubectl create -f pacman-tanzu/rbac/rbac.yaml -n pacman
kubectl create -f pacman-tanzu/services/mongo-service.yaml -n pacman
kubectl create -f pacman-tanzu/services/pacman-service.yaml -n pacman
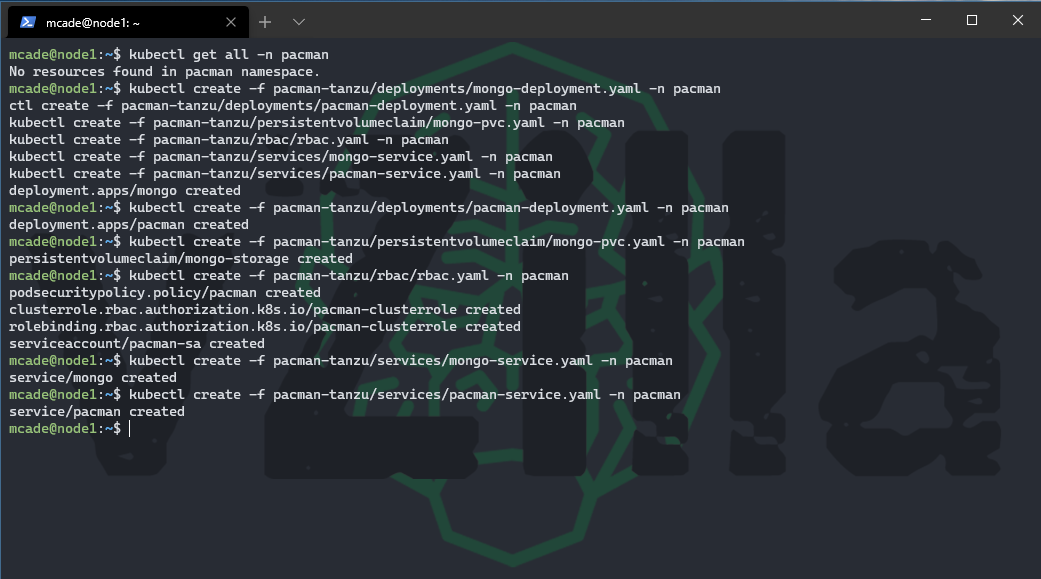
if you did want to delete everything that we just created you can also just find and replace the “create” with “delete” and then run the following commands to remove all the same components.
kubectl delete -f pacman-tanzu/deployments/mongo-deployment.yaml -n pacman
kubectl delete -f pacman-tanzu/deployments/pacman-deployment.yaml -n pacman
kubectl delete -f pacman-tanzu/persistentvolumeclaim/mongo-pvc.yaml -n pacman
kubectl delete -f pacman-tanzu/rbac/rbac.yaml -n pacman
kubectl delete -f pacman-tanzu/services/mongo-service.yaml -n pacman
kubectl delete -f pacman-tanzu/services/pacman-service.yaml -n pacman
and then finally to confirm that everything is running as it should we can run the following command and see all of those components
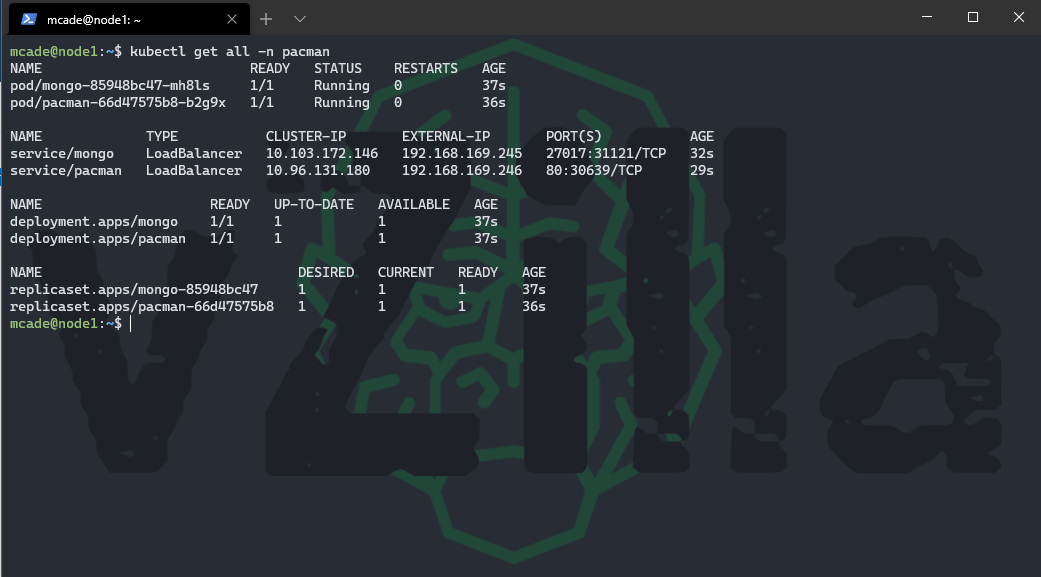
From the above you will also see that we have an external IP for our MongoDB instance and our pacman front end. Let’s take that pacman IP address and put it in our web browser to play some pacman.
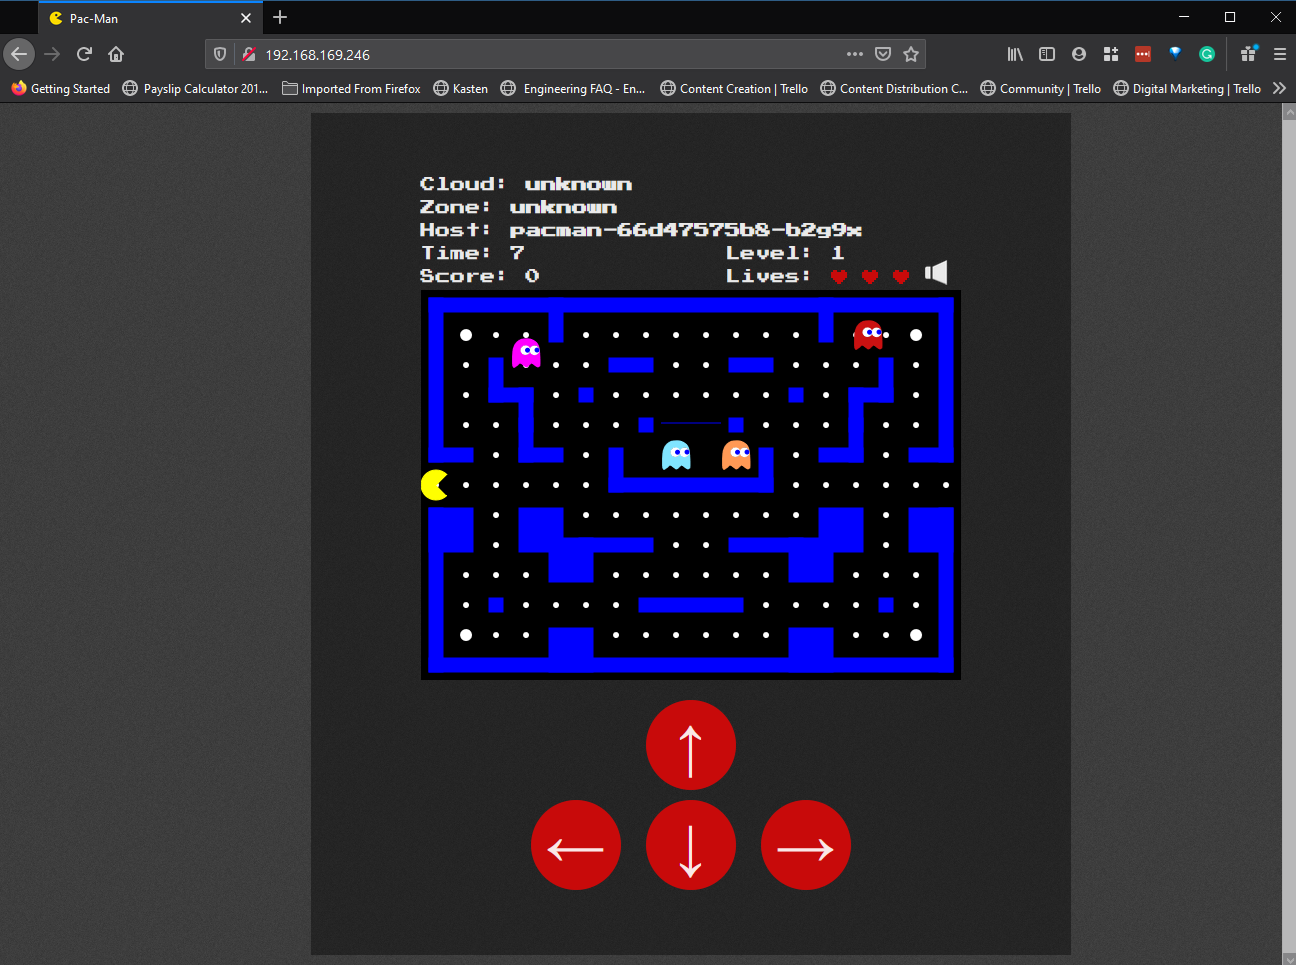
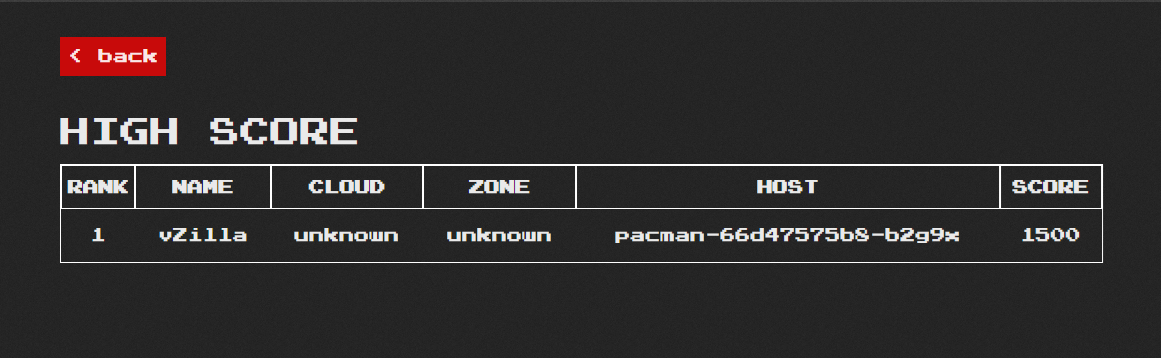
Hopefully this was helpful to somebody, this also leads into a great demo that myself and Dean have been doing where Kasten K10 will come and protect that stateful data, the mission critical high scores that you don’t want to be losing. Obviously, this is out there and available, there are many other viable demos that can be used to play in your home labs and get to grips of the different components. In the next post we will finish off this series by looking at Kasten and the deployment and configuration of K10 and how simple it is to get going even more so if you have been following along here.
Tweet me with your high scores
In the last post, we talked about the Kubernetes context and how you can flip between different Kubernetes cluster control contexts from your Windows machine. We have also spoken about in this series how load balancing gives us better access to our application vs using the node port for access.
This post will highlight how simple it is to deploy your load balancer and configure it for your home lab Kubernetes cluster.
Roll your own Kubernetes Load Balancer
If you deployed your Kubernetes cluster in Cloud, the cloud provider will take care of creating Load balancer instances. But if you are using bare metal for the Kubernetes cluster, you have very limited choices which are where we are in this home lab scenario this also enables us to have a choice and to understand why. As I mentioned this is going to be using MetalLB.
Let’s start with what it looks like without a load balancer on bare metal when we are limited to Node or Cluster port configurations. So I am going to create an Nginx pod.
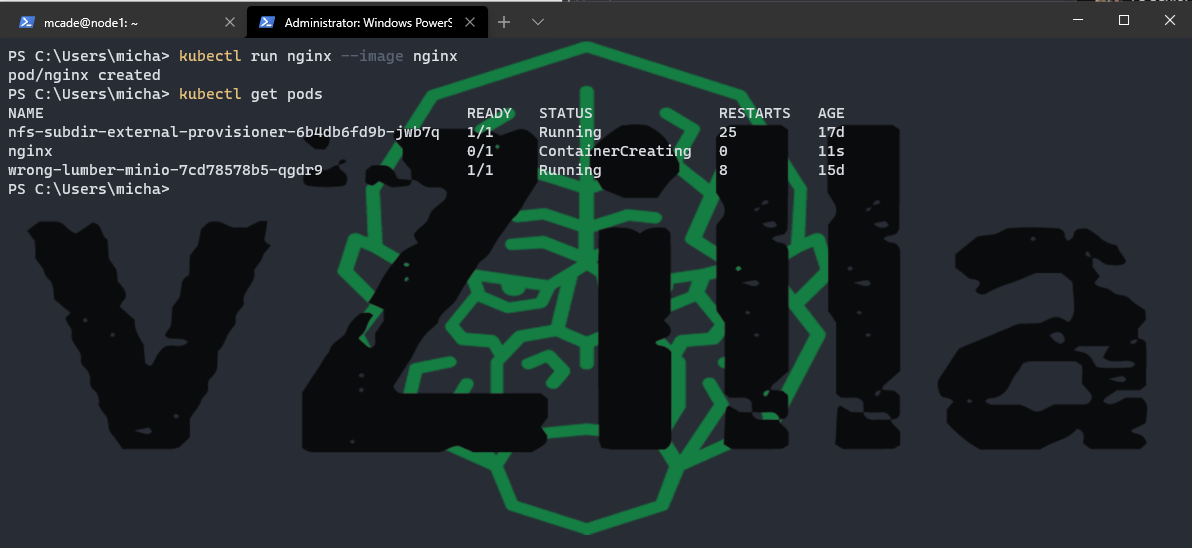
If we did not have a load balancer configured but we used the following command here. It would stay in the pending state until we did have a load balancer.
kubectl expose deploy nginx –port 80 –type LoadBalancer
Installing MetalLB into your Kubernetes Cluster
To start you can find the installation instructions here. The following commands, in general, is going to deploy MetalLB to your cluster, it will create a namespace called metallb-system and it will create a controller which is what will control IP address assignments and then also speaker which handles the protocols you wish to use.
kubectl create namespace metallb-system
kubectl apply -f https://raw.githubusercontent.com/metallb/metallb/v0.9.5/manifests/namespace.yaml
kubectl apply -f https://raw.githubusercontent.com/metallb/metallb/v0.9.5/manifests/metallb.yaml
# On the first install only
kubectl create secret generic -n metallb-system memberlist –from-literal=secretkey=”$(openssl rand -base64 128)”
when you have than these you should see the new namespace metallb-system and be able to run the following command
kubectl get all -n metallb-system
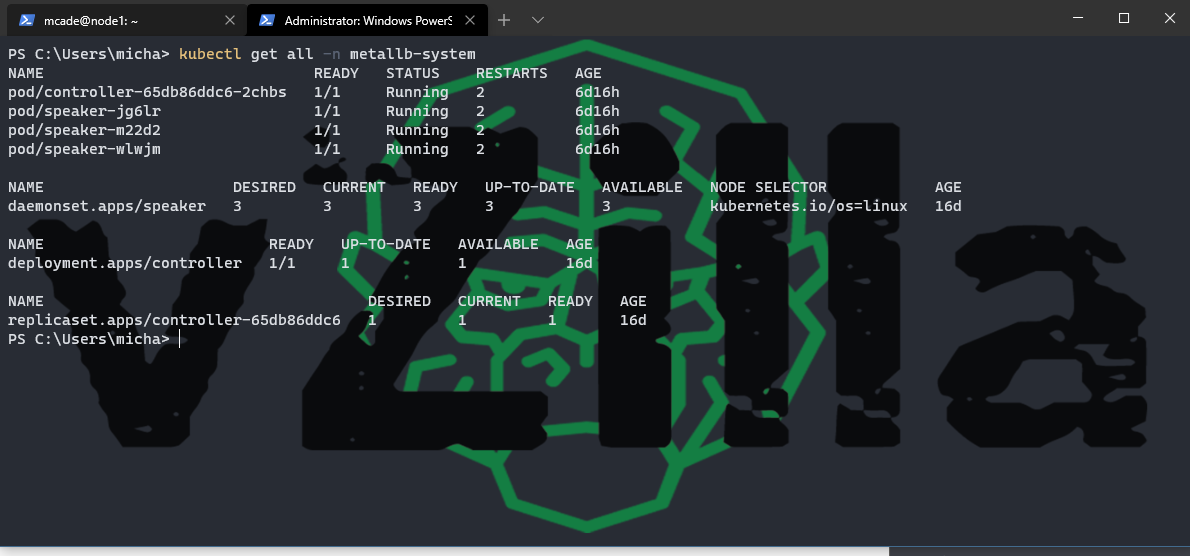
We then need a config map to make it do something or at least use specific IP addresses on our network, I am using Layer2 in my lab configuration but there are other options that you can find here.
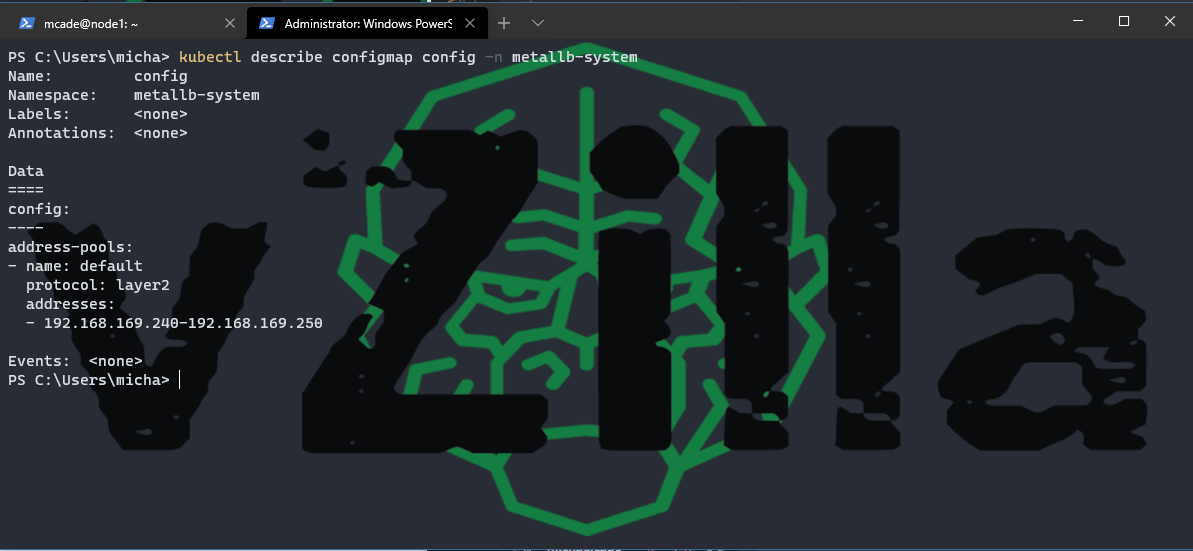
Create your YAML if layer2 as above with a range of IP addresses available on your home lab network and then apply this into your configuration. Where config.YAML is the YAML file with your config as per the above is located.
kubectl apply -f config.yaml
now when you deploy a service that requires port type as LoadBalancer
kubectl expose deploy nginx –port 80 –type LoadBalancer
Instead of pending now, this will give you an IP address available on your home lab network, which is great then if you want to access this from outside your cluster. Now if we check another application I have running already in my cluster. You will see the following when you use the LoadBalancer type on deployment.
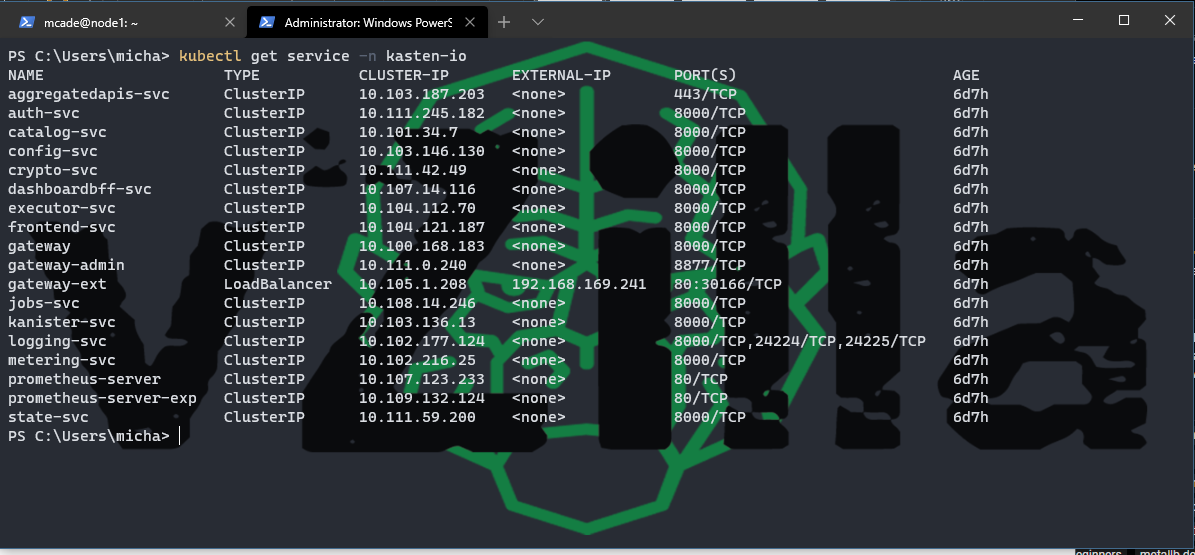
And then if we go into that service and describe we can then see that configuration
I want to give another shout out to just me and opensource if you are a consumer of video vs written or both then this guy has created an amazing Kubernetes playlist covering all things Kubernetes and more.
In the next post, we are going to focus on hitting the easy button for our apps using KubeApps, where things do not need to be all in the shell there are also UI options, KubeApps is the “Your Application Dashboard for Kubernetes”
]]>
In the last post, we covered an overview of Helm and the MinIO deployment to give us an option for testing later on workloads that require object storage. In this post, we are going to focus on context and how to make sure you have access from your desktop to your Kubernetes Cluster.
Context
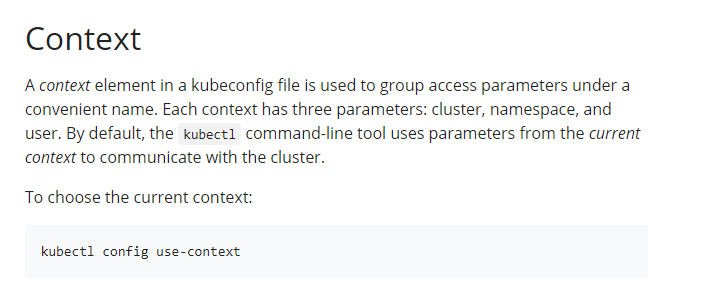
Image is taken from Kubernetes.io
Context is important, the ability to access your Kubernetes cluster from your desktop or laptop is required. Lots of different options out there and people use obviously different operating systems as their daily drivers.
In the post we are going to be talking about Windows but as I said there are other options out there for other operating systems. More to the point if you are managing multiple Kubernetes clusters for different projects or learning.
By default, the Kubernetes CLI client uses the C:\Users\username\.kube\config to store the Kubernetes cluster details such as endpoint and credentials. If you have deployed a cluster you will be able to see this file in that location. But if you have been using maybe the master node to run all of your kubectl commands so far via SSH or other methods then this post will hopefully help you get to grips with being able to connect with your workstation.
Once again Kubernetes.io have this document
Install the Kubernetes-CLI
First, we need the Kubernetes CLI installed on our Windows Machine, I used chocolatey with the following command.
choco install kubernetes-cl
We then need to grab the kubeconfig file from the cluster, grab the contents of this file either via SCP or just open a console session to your master node and copy to the local windows machine. The location of the config is listed below.
$HOME/.kube/config
If you have taken the console approach, then you will need to get the contents of that file and paste into the config location on your Windows machine. You could go ahead and run the following command but this is going to contain redacted information so this will not work if you take a copy of this to your windows machine.
kubectl config view
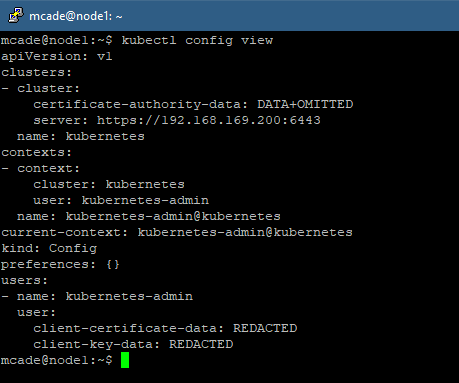
What we need to do is get those redacted values to copy over to our windows machine, you can achieve this by running the following commands
cd $HOME/.kube/
ls
cat config
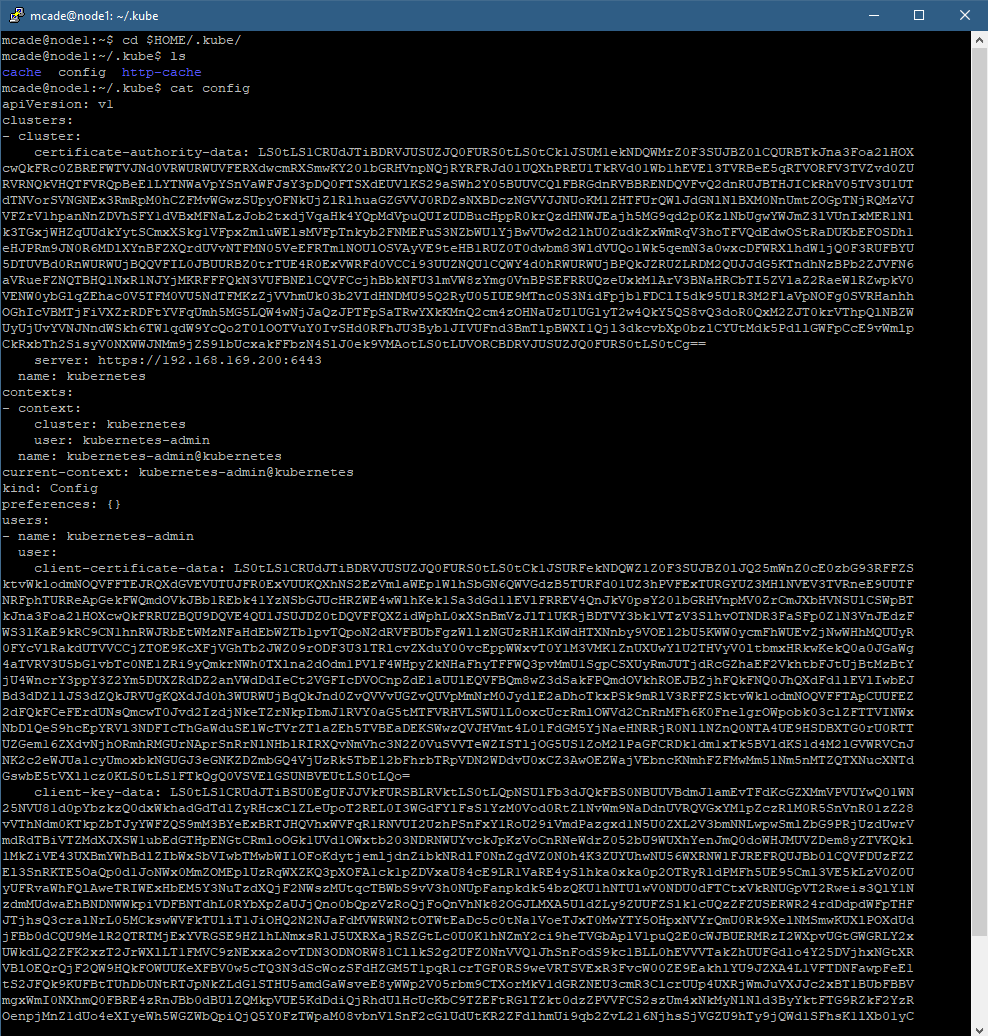
That the above starting at the apiVersion: v1 down to the bottom of the file and copy that to your .kube directory on windows. This same process is similar for other operating systems.
C:\Users\micha\.kube\config
If you want to open the file, then you will be able to compare that to what you saw on the shell of your master node.
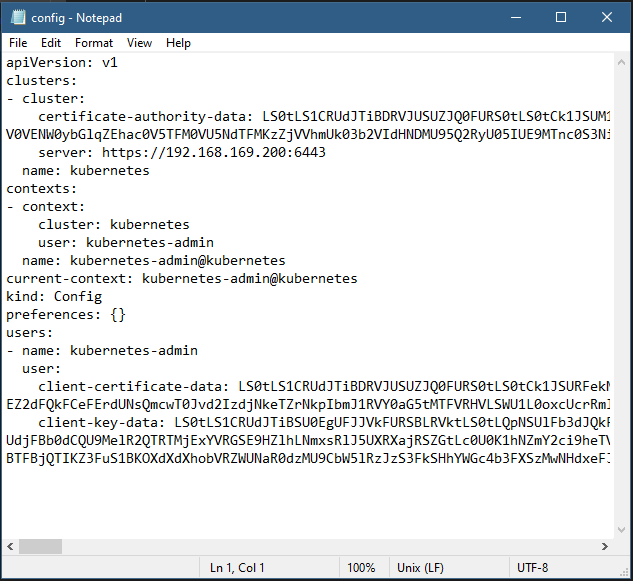
You will now be able to check in on your K8 cluster from the windows machine
kubectl cluster-info
kubectl get nodes
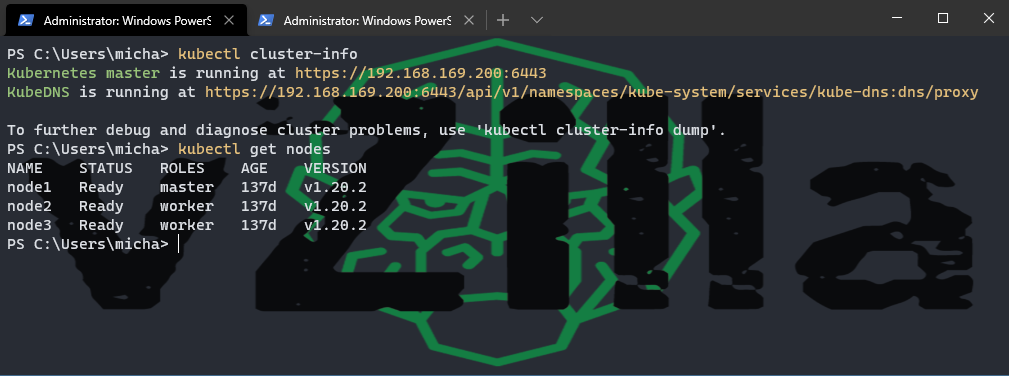
This not only allows for connectivity and control from your windows machine but this then also allows us to do some port forwarding to access certain services from our windows machine. We can cover them off in a later post.
Multiple Clusters
A single cluster is simple, and we are there with the above specifically on Windows. But accessing multiple clusters using contexts is really what you likely came here to see.
Again some awesome documentation that you can easily run through.
For this post though I have my home lab cluster that we have been walking through and then I have also just deployed a new EKS cluster in AWS. The first thing to notice is that the config file is now updated with multiple clusters. Also, note I do not use notepad as my usual go-to for editing YAML files.
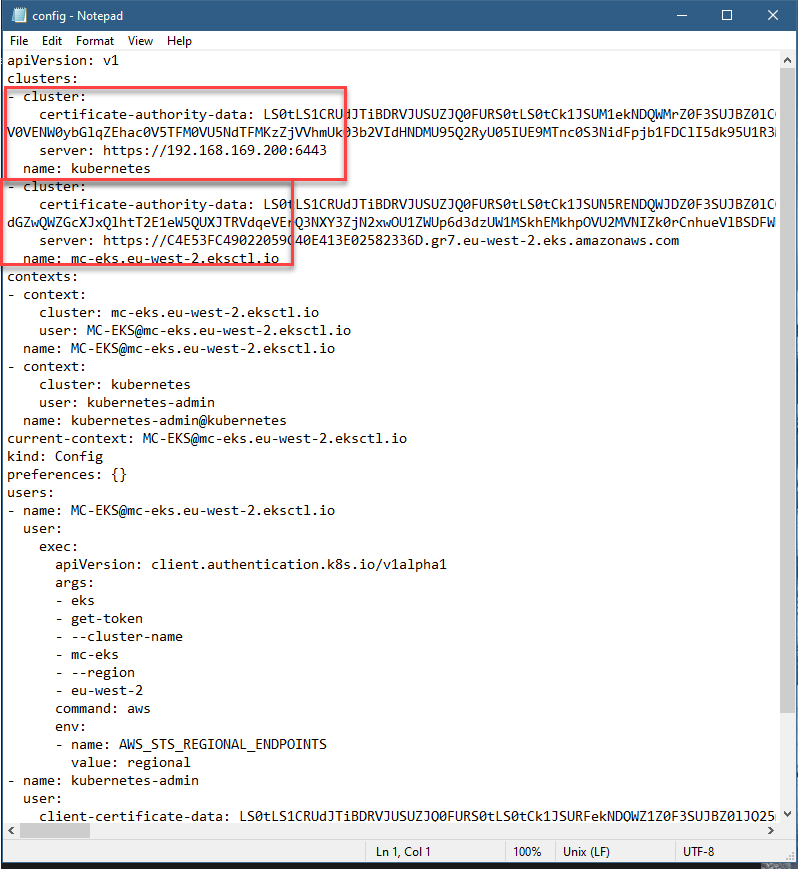
Then also notice in the same screen grab that we have multiple contexts displayed.
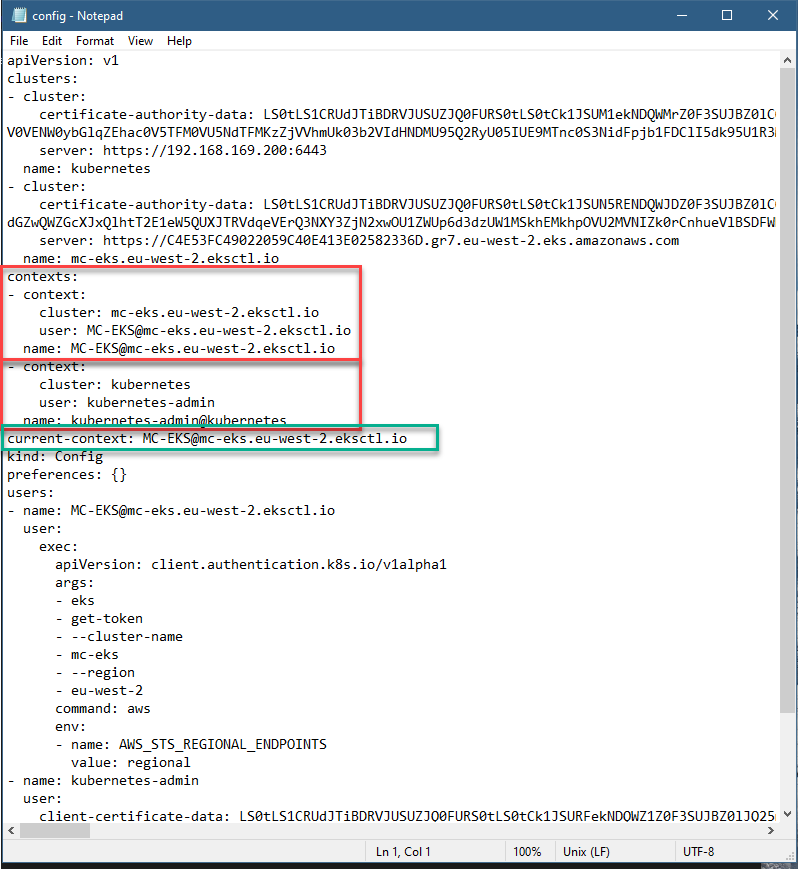
So now if I run the same commands we ran before.
kubectl cluster-info
kubectl get nodes
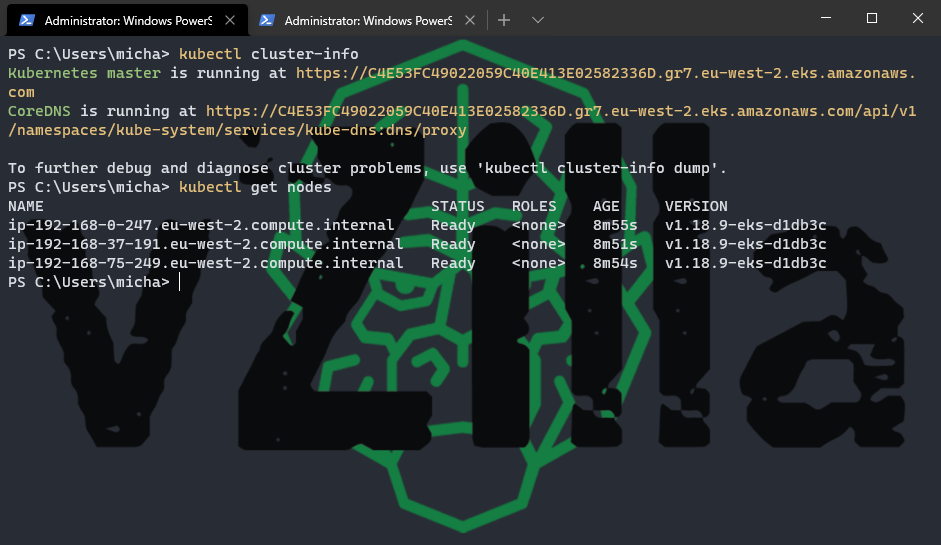
We can see that the context has been changed over, and actually, this is done automatically with the EKS commands and I am not sure if this is the same process for other cloud providers something we will get to in later posts. But now we are on the AWS cluster and can work with our cluster from our windows machine. So how do we view all of the possible contexts that we may have in our config file?
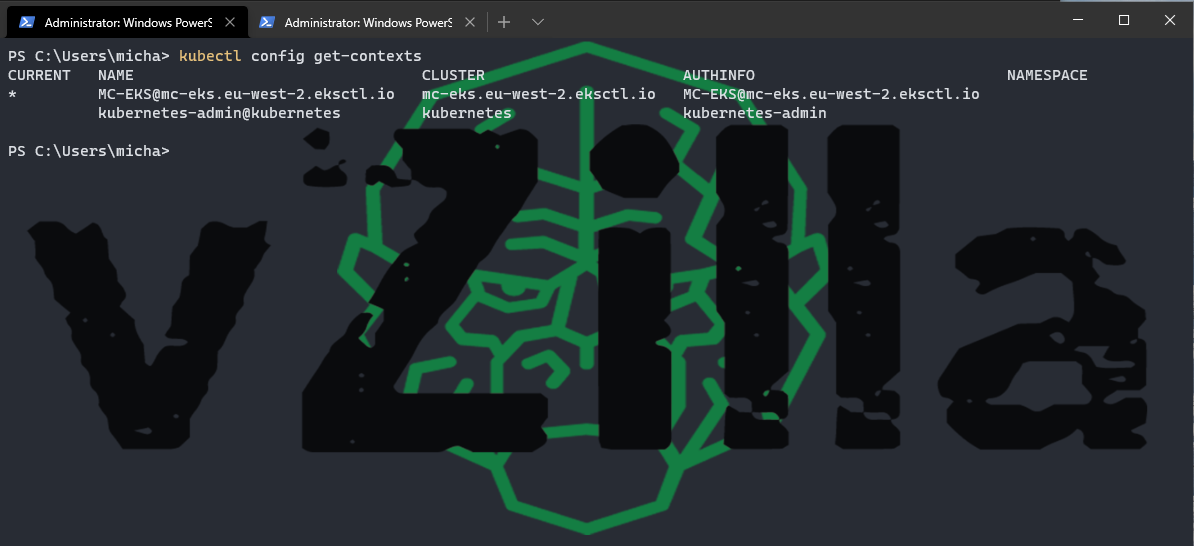
kubectl config get-contexts
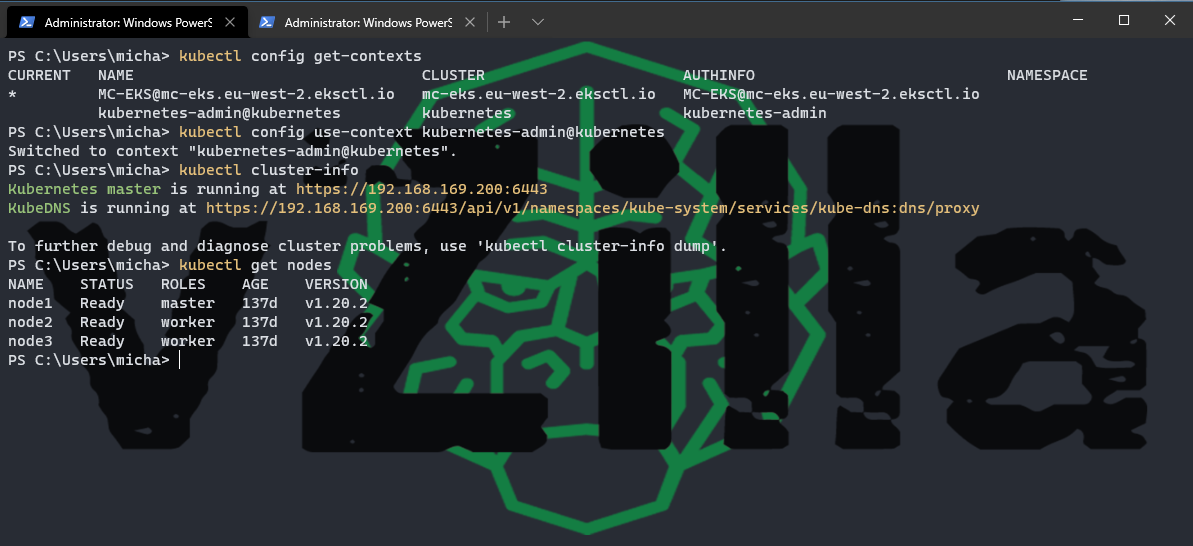
And if we want to flip between the clusters you simply run the following command, you will then see how we switched over to the other context and back into our home lab cluster.
kubectl config use-context Kubernetes-admin@kubernetes
One thing to note is that I also store my .pem file in the same location as my config file, I have been reading about some best practices that if you have multiple config requirements you could start creating a folder structure with all of your test clusters, all of your development clusters and then live and so on.
Note Update – As I have been playing a little with AWS EKS and Microsoft AKS, AWS seems to take care of the clean up of your kubeconfig files whereas AKS does not so I found the following commands very useful when trying to keep that config file clean and tidy.
kubectl config delete-cluster my-cluster

kubectl config delete-context my-cluster-context
Hopefully, that was useful, and in the next post, we will take a look at the load balancer that I am using in the home lab.
]]>
In the last post, we covered setting up dynamic shared storage with my NETGEAR ReadyNAS system for our Kubernetes storage configuration. This is what I have in my home lab but any NFS server would bring the same outcome for you in your configuration.
This post will cover two areas we will continue to speak to Kubernetes storage options but we will cover object storage, I am going to use MinIO to be able to have an object storage option in my lab, I can use this to practice some tasks and demo things between Veeam Backup & Replication and Kasten and storing backup files. Also, in this post, we will cover Helm and Helm charts.
What is Helm?
Helm is a package manager for Kubernetes. Helm could be considered the Kubernetes equivalent of yum or apt. Helm deploys charts, which you can think of like a packaged application., it is a blueprint for your pre-configured application resources which can be deployed as one easy to use chart. You can then deploy another version of the chart with a different set of configurations.
They have a site where you can browse all the Helm charts available and of course you can create your own. The documentation is also clear and concise and not as daunting as when I first started hearing the term helm amongst all of the other new words in this space.
How do I get helm up and running?
It is super simple to get Helm up and running or installed. Simply. You can find the binaries and download links here for pretty much all distributions including your RaspberryPi arm64 devices.
Or you can use an installer script, the benefit here is that the latest version of the helm will be downloaded and installed.
$ curl -fsSL -o get_helm.sh https://raw.githubusercontent.com/helm/helm/master/scripts/get-helm-3
$ chmod 700 get_helm.sh
$ ./get_helm.sh
Finally, there is also the option to use a package manager for the application manager, homebrew for mac, chocolatey for windows, apt with Ubuntu/Debian, snap and pkg also.
Helm so far seems to be the go-to way to get different test applications downloaded and installed in your cluster, something that we will also cover later is KubeApps which gives a nice web interface to deploy your applications but I still think this uses helm charts for the way in which the applications are deployed.
MinIO deployment
I think I mentioned in a previous post that I wanted an object storage option built on Kubernetes to test out scenarios where Object Storage is required for exports and backups. This being a home lab will automatically mean we are not going to be using any heavy load or performance testing but around some demos this is useful. What this also means is that the footprint of running MinIO within my cluster is very low compared to having to run a virtual machine or physical hardware.
Once again documentation from MinIO is on point, which was actually a misconception that I maybe had of this Kubernetes and CNCF world was that the documentation might or maybe lacking across the board but actually, that is not the case at all everything I have found has been really good.
Obviously, as we went to the trouble above installing Helm on our system we should go ahead and use the MinIO helm chart to bootstrap the MinIO deployment into our Kubernetes cluster.
Configure the helm repo
<span style="color: #24292e; font-family: Consolas;">helm repo add minio https://helm.min.io/

</span>
Install the chart
<span style="color: #24292e; font-family: Consolas;">helm install --namespace minio --generate-name minio/minio

</span>
I also went through the steps to create a self-signed certificate to use here those steps can be found here.
How to get the default secret and access keys
I deployed my MinIO deployment within my default namespace by mistake and have not resolved this so the following commands need to take that into consideration. First, get a list of all the secrets in the namespace, if you have a namespace exclusive to MinIO then you will see only those secrets available. I added a grep search to only show minio secrets.
kubectl get secret | grep -i minio
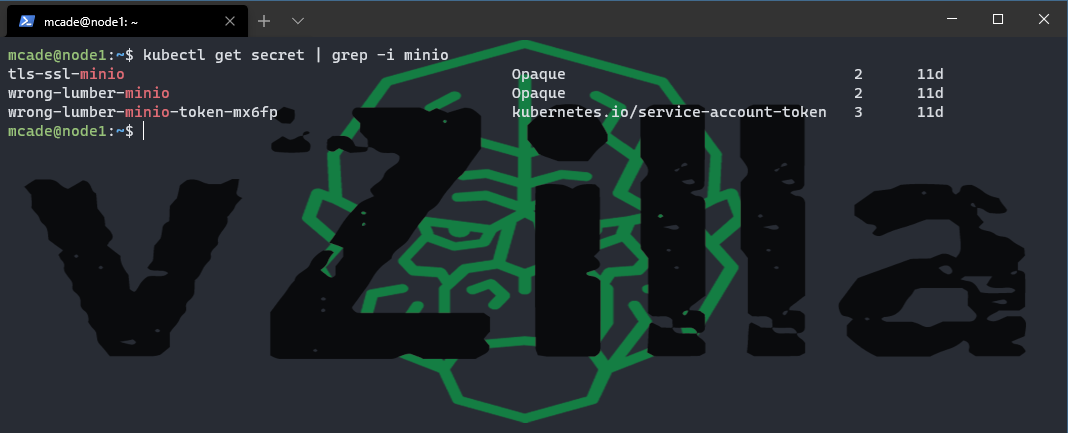
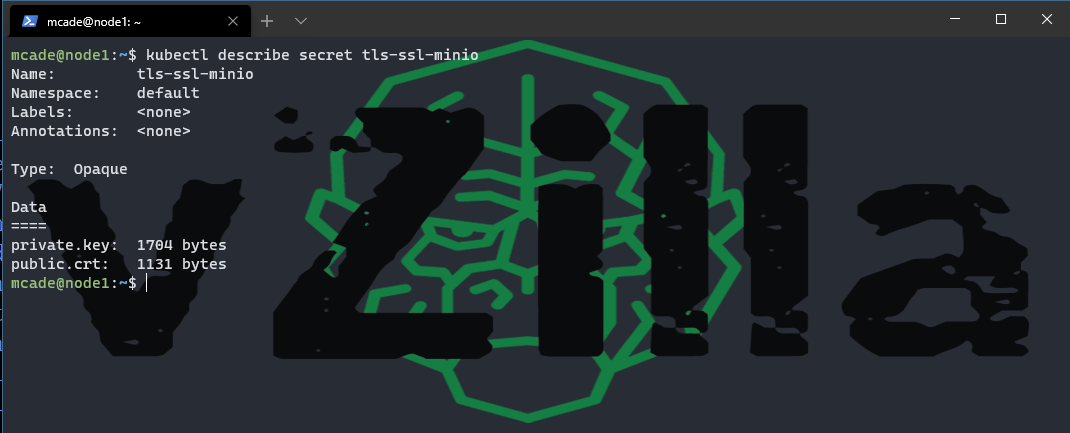
If you have set up a self-signed or third-party certificate, then you will likely have a secret called “tls-ssl-minio”
kubectl get secret tls-ssl-minio
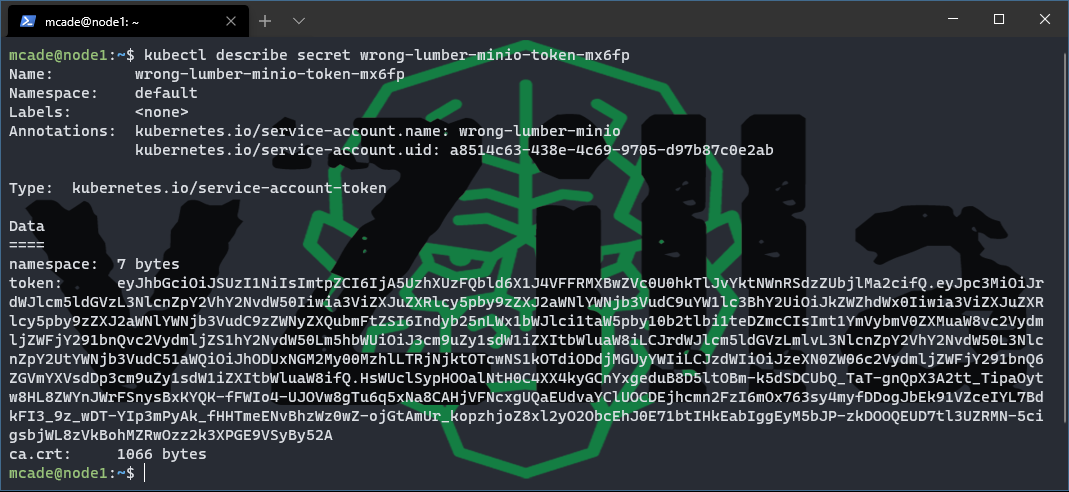
you will also have a service account that may look familiar to my command below, although I think all names are random
kubectl describe secret wrong-lumber-minio-token-mx6fp
then you will have finally the one we need with the access and secret keys in.
kubectl describe secret wrong-lumber-minio
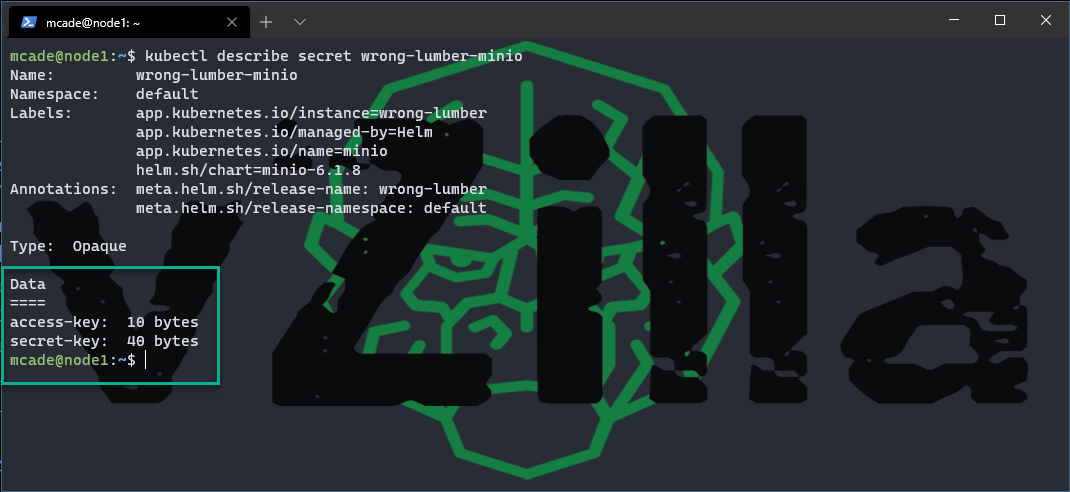 you should notice at the bottom here two data types access-key and secret-key, we next need to find out more from these. If we run the following we will get those values.
kubectl get secret wrong-lumber-minio -o jsonpath='{.data}’
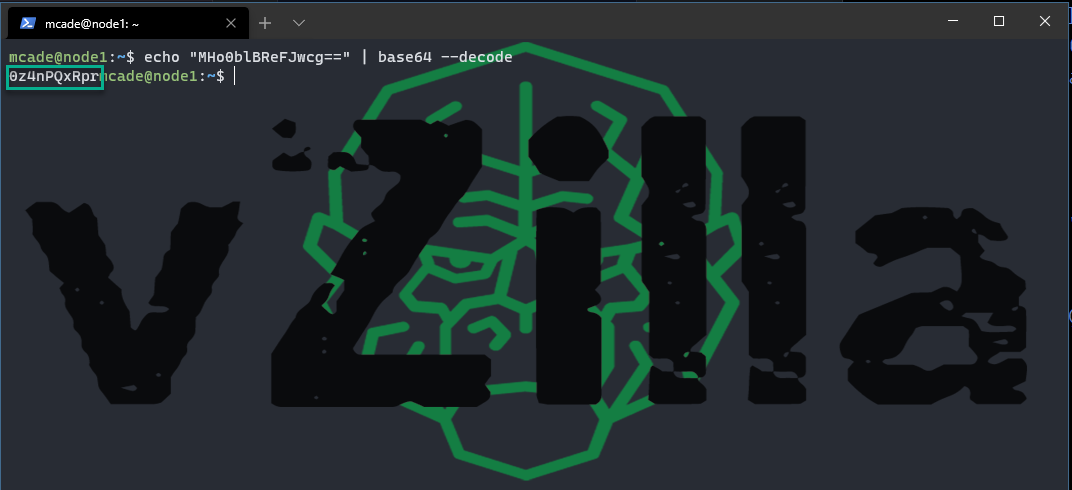
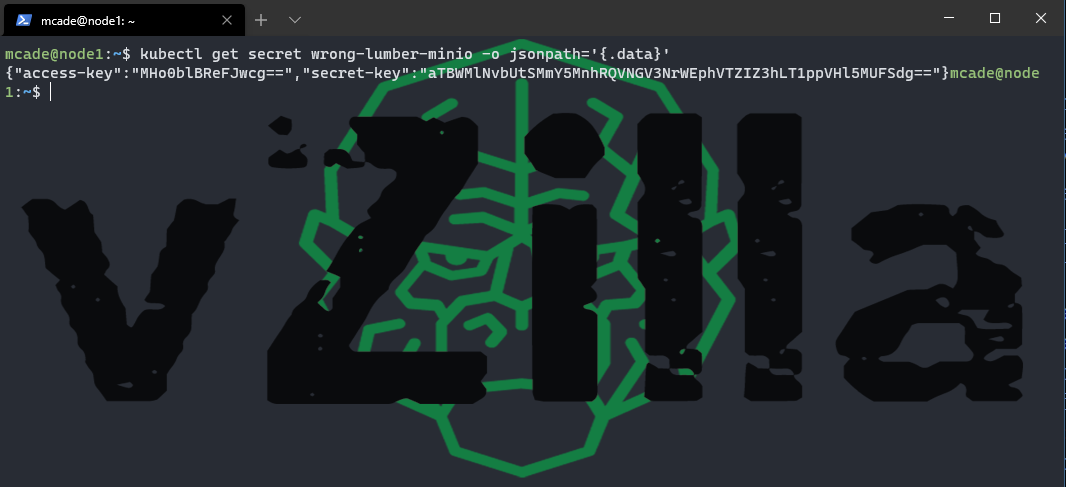 but one more thing we need to encode them. Let’s start with the access key
echo “MHo0blBReFJwcg==” | base64 –decode
and now the secret key
echo “aTBWMlNvbUtSMmY5MnhRQVNGV3NrWEphVTZIZ3hLT1ppVHl5MUFSdg==” | base64 –decode
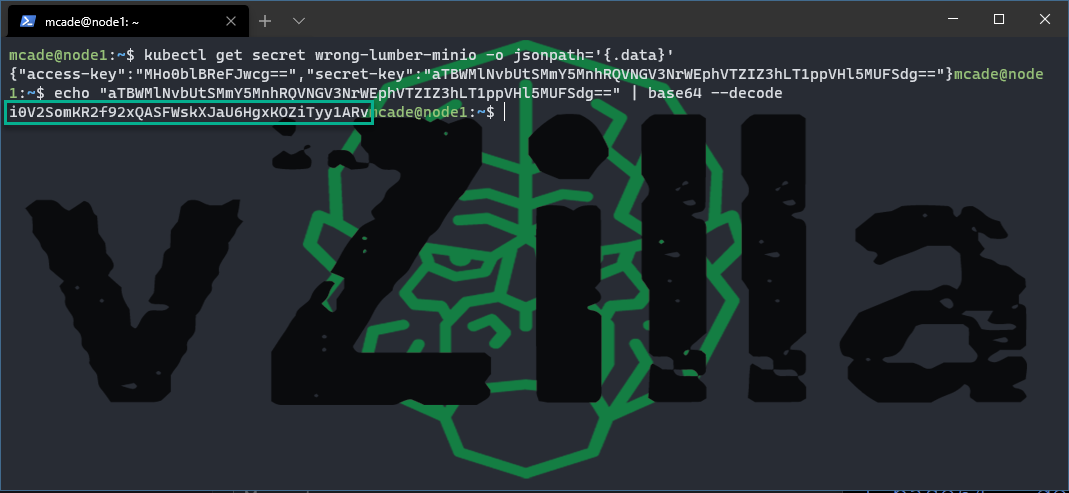
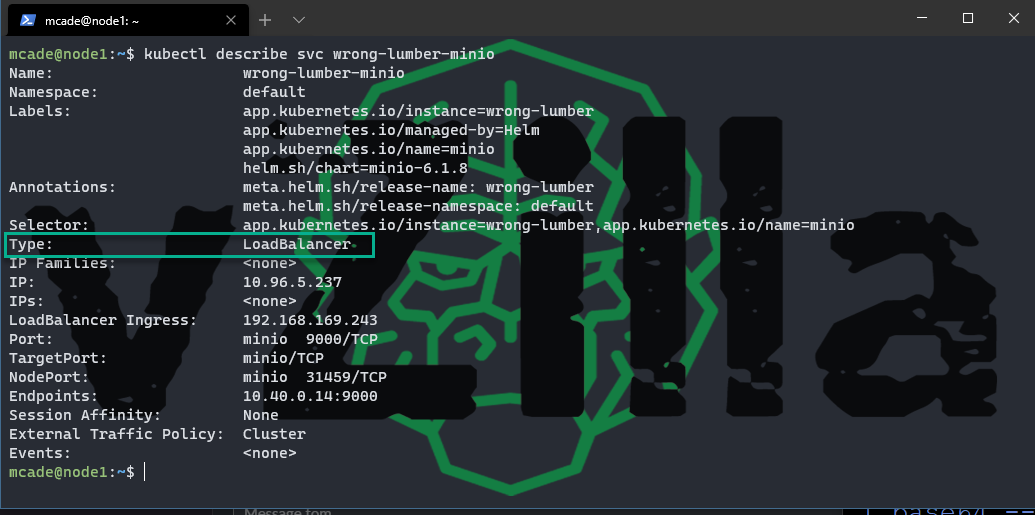
Now we can confirm access to the front-end web interface with the following command
kubectl get svc
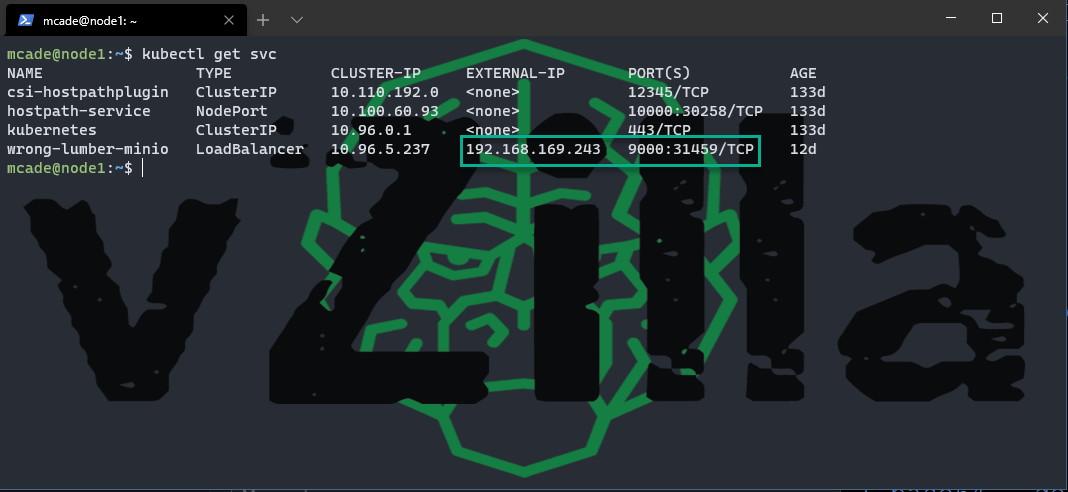
Note that I am using a load balancer here which I added later to the configuration.
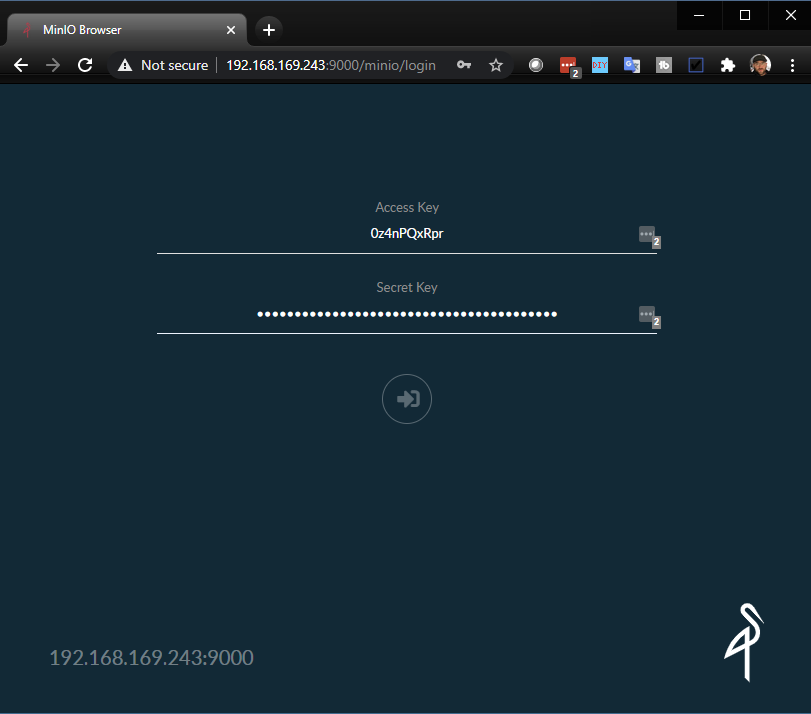
Now with this configuration and the access and secret keys you can open a web browser and navigate to http://192.168.169.243:9000
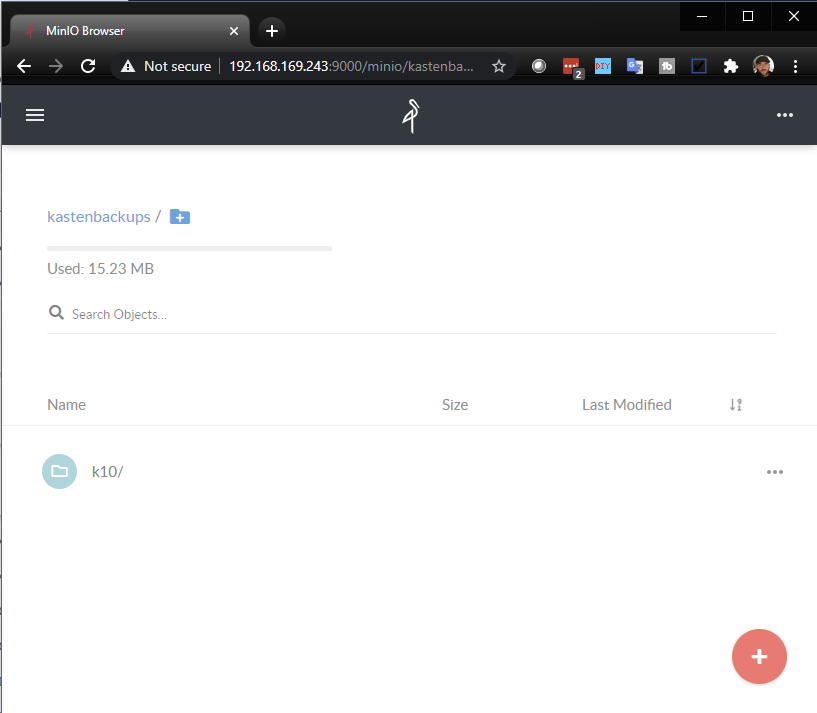
You will then have the ability to start creating your S3 buckets for your use cases, you can see here that a future post will be covering this as a use case where I can export backups to object storage using Kasten K10.
In the next post, I will be working on how to access your Kubernetes cluster from your windows machine.
]]>
In the last three parts we covered, starting from scratch and getting the Kubernetes platform ready, this was using some old hardware and creating some virtual machines to act as my nodes. But if you don’t have old hardware but you still wish to build out your cluster then these virtual machines can really sit wherever they need to, for example, they could be in the public cloud but remember this is going to cost you. My intention was to remove all costs as possible as this system I am using is always running in my home network as it acts as my backup server as well as for tasks like this. We also covered how we got the Kubernetes cluster created using Kubeadm and then we started playing with some stateless applications and pods.
In this post we are going to start exploring the requirements around stateful by setting up some shared persistent storage for stateful applications. There was also something else I was playing with local persistent volumes and you can read more about that here on the Kubernetes Blog.
Stateful vs Stateless
Stateless that we mentioned and went through in the last post is where the process or application can be understood alone, there is no storage associated to the process or application therefore it is stateless, stateless applications provide one service or function.
Taken from RedHat: An example of a stateless transaction would be doing a search online to answer a question you’ve thought of. You type your question into a search engine and hit enter. If your transaction is interrupted or closed accidentally, you just start a new one. Think of stateless transactions as a vending machine: a single request and a response.
Stateful processes or applications are those that can be returned to again and again, think about your shopping trolley or basket in an online store if you leave the site and come back to the site in an hour site if the site is configured well then it is likely that this remembers your choices so you can easily make that purchase rather than having to go through the process of picking everything again into your cart. A good description I read whilst researching this was, think of stateful like an ongoing conversation with a friend or colleague on a chat platform, it is always going to be there regardless of the time between talking. Where as stateless, when you leave that chat or after a period those messages are lost forever.
If you google “Stateful vs Stateless” you will find so much information and examples, but for my walkthrough the best way to describe stateless is through what we covered in the last post, web servers and load balancers (stateless) to what we are going to cover here and the next post around databases (stateful) there are many other stateful workloads such as messaging queues, analytics, data science, machine learning (ML) and deep learning (DL) applications.
Back to the lab
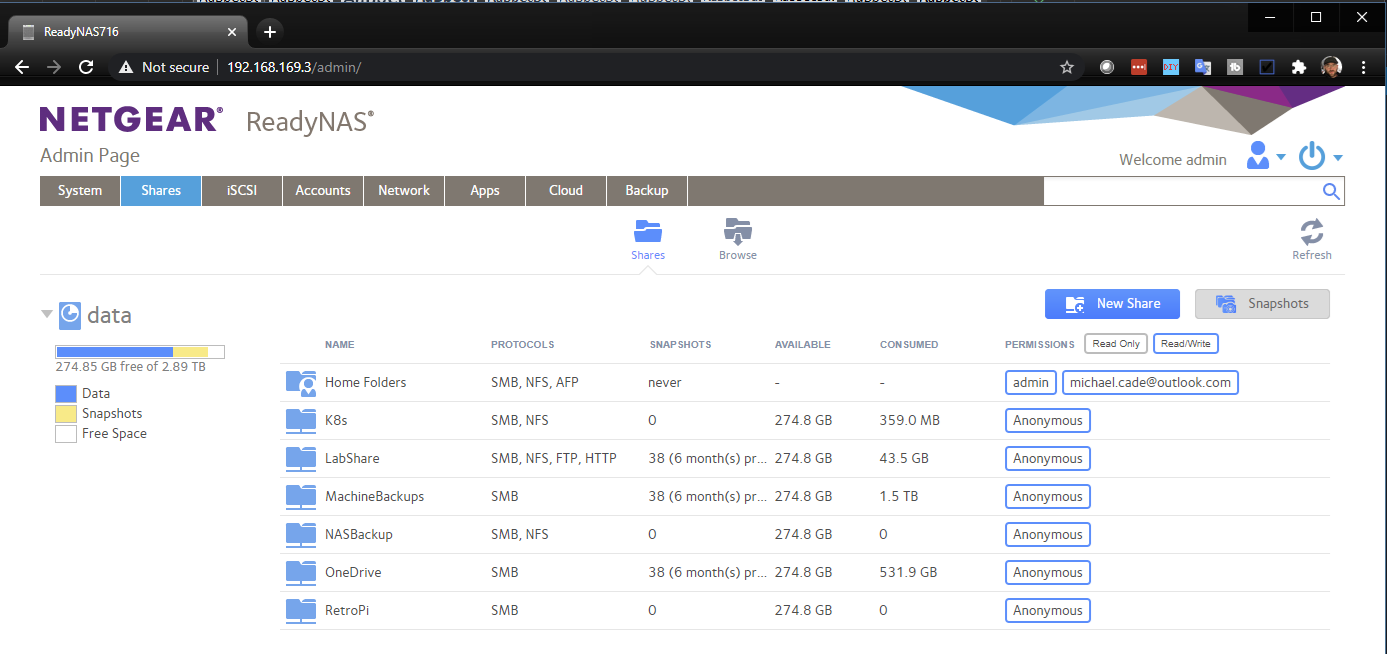
I am running a NETGEAR ReadyNAS 716 in my home lab that can serve both NAS protocols (SMB & NFS) and iSCSI. It has been a perfect backup repository for my home laptops and desktop machines, and this is an ideal candidate for use in my Kubernetes cluster for stateful workloads.
I went ahead and created a new share on the NAS called “K8s” that you can see on the image below.
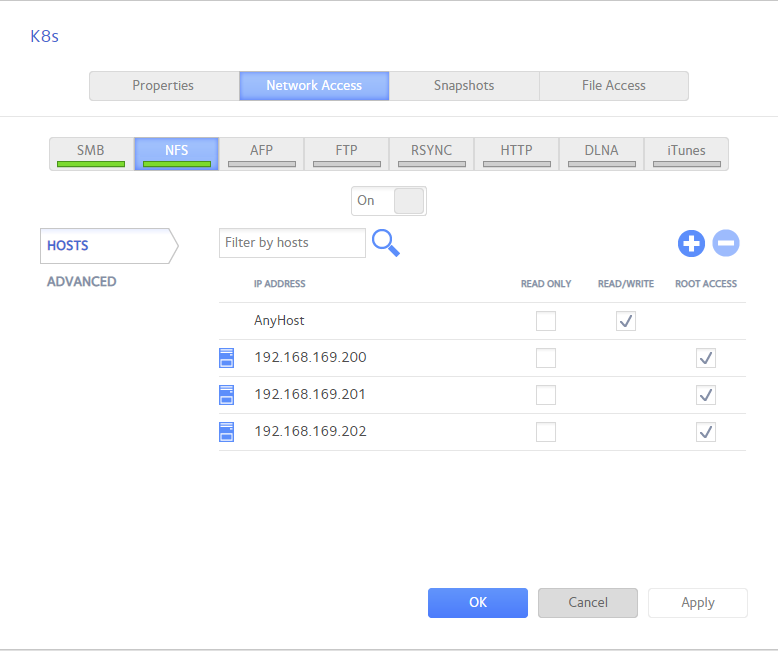
I then wanted to make sure that the folder was accessible over NFS by my nodes in the Kubernetes cluster
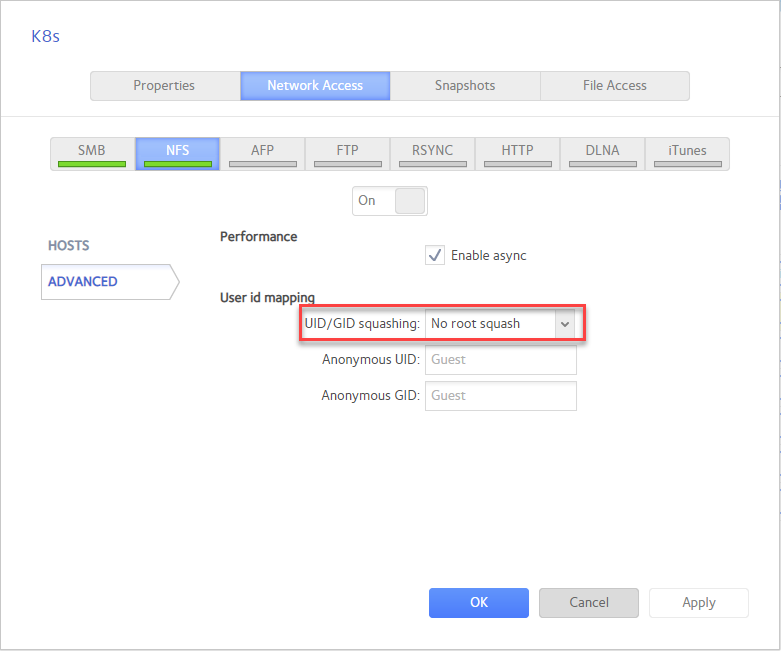
This next setting had some strange issues until I found out how this was affecting what we were trying to achieve. Basically, with this default setting (root squash) this was causing issues where persistent volumes could be created but then additional folder structure or folders could not always be created it was very sporadic although the same each time we tested.
Root squash is a special mapping of the remote superuser (root) identity when using identity authentication (local user is the same as remote user). Under root squash, a client’s uid 0 (root) is mapped to 65534 (nobody). It is primarily a feature of NFS but may be available on other systems as well.
Root squash is a technique to void privilege escalation on the client machine via suid executables Setuid. Without root squash, an attacker can generate suid binaries on the server that are executed as root on other client, even if the client user does not have superuser privileges. Hence it protects client machines against other malicious clients. It does not protect clients against a malicious server (where root can generate suid binaries), nor does it protect the files of any user other than root (as malicious clients can impersonate any user).
A big shout out to Dean Lewis here who helped massively get this up and running. He also has some great content over on his site.
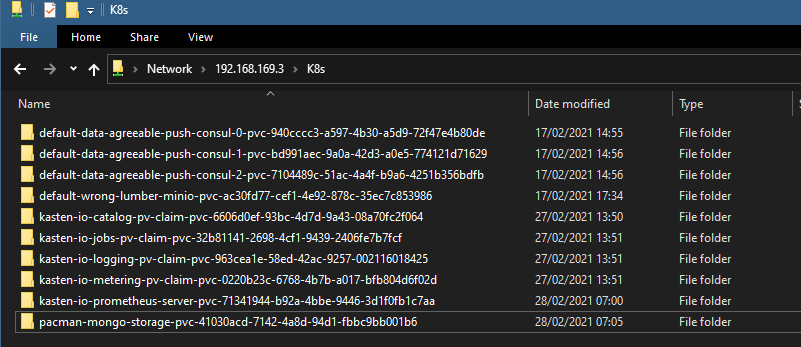
I also enabled SMB so that I could see what was happening on my Windows machine during some of the stages. This is also how we discovered the first issue when some folders were not being created, we then created them, and the process would get that step further so that No Root Squash setting is super important.
Kubernetes – NFS External Provisioner
Next, we needed an automatic provisioner that would use our NFS server / shares to support dynamic provisioning of Kubernetes persistent volumes via persistent volume claims. We did work through several before we hit on this one.
The Kubernetes NFS Subdir external provisioner enabled us to achieve what we need to be able to do for our stateful workloads with the ability to create those dynamic persistent volumes. It is deployed using a helm command.
Note – I would also run this on all your nodes to install the NFS Client
apt-get install nfs-common
helm repo add nfs-subdir-external-provisioner https://kubernetes-sigs.github.io/nfs-subdir-external-provisioner/
helm install nfs-subdir-external-provisioner nfs-subdir-external-provisioner/nfs-subdir-external-provisioner \

 --set nfs.server=192.168.169.3 \

 --set nfs.path=/data/K8s
kubectl patch storageclass nfs-client -p '{"metadata": {"annotations":{"storageclass.kubernetes.io/is-default-class":"true"}}}'
Now when we cover stateful applications you will understand how the magic is happening under the hood. In the next post we will look at helm in more detail and also start to look at a stateful workload with MinIO.
]]>
In the last post, we went through creating our home lab Kubernetes cluster and deploying the Kubernetes dashboard. In this post we are going to create a couple more stateless applications.
What is BusyBox
Several stripped-down Unix tools in a single executable file.
Commonly referred to as the “Swiss army knife tool in Linux distributions”
I began by just testing this following a walkthrough tutorial but then later realised that this is a great tool for troubleshooting within your Kubernetes pod.
You can find out more information here on Docker Hub.
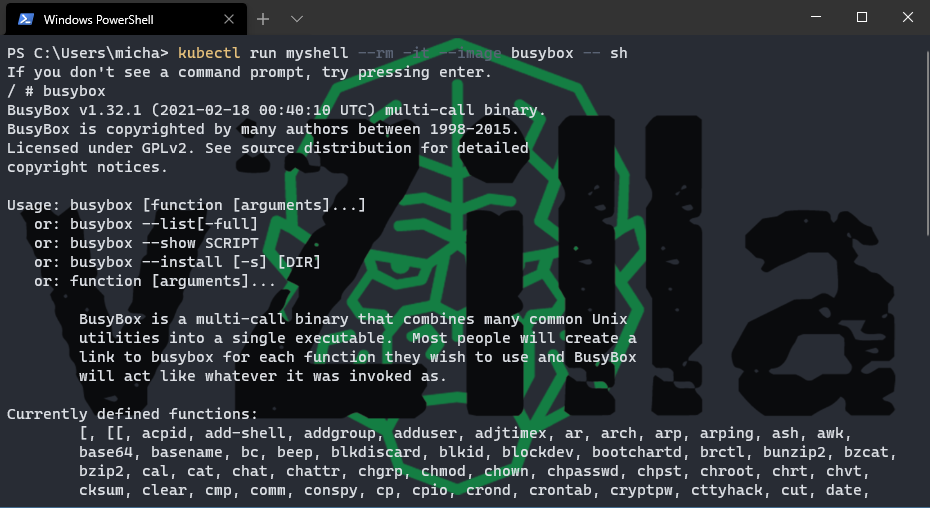
kubectl run myshell –rm -it –image busybox – sh
Some things you didn’t know about kubectl The above kubectl command is equivalent to docker run -i -t busybox sh.
When you have run the above kubectl run command for busybox this gives you a shell that can be used for connectivity and debugging your Kubernetes deployments. Kubernetes lets you run interactive pods so you can easily spin up a busybox pod and explore your deployment with it.
NGINX deployment
Next, we wanted to look at NGNIX, NGINX seems to be the defacto in all the tutorials and blogs that I have come across when it comes to getting started with Kubernetes. Firstly it is open-source software for web serving, reverse proxying, caching, load balancing, media streaming and their description here go into much more detail. I began walking through the steps below to get my NGINX deployment up and running in my home Kubernetes cluster.
kubectl create deployment nginx –image=nginx
at this point if we were to run kubectl get pods then we would see our NGINX pod in a running state.
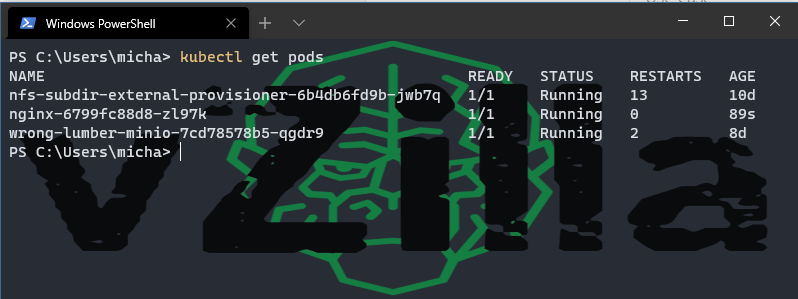
Now if we want to scale this deployment, we can do this by running the following command. For the demo I am running this in the default namespace if you were going to be actually keeping this and then working on this you would likely define a better namespace location for this workload.
kubectl scale deploy nginx –replicas 2
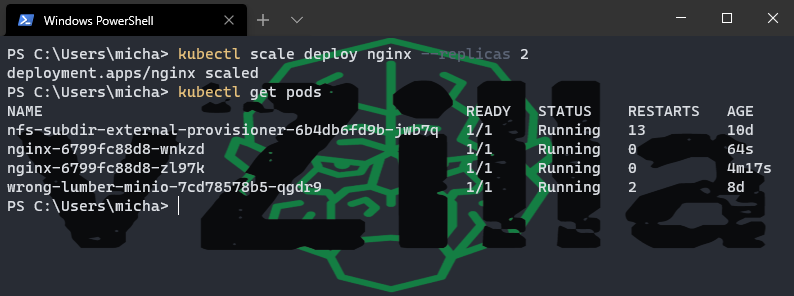
You can manually scale your pods as you can see above or you can use the kubectl autoscale command which allows you to set minimum pods and maximum pods and this should be the moment where you go, hang on this sounds like where things get really interesting and the reason why Kubernetes full stop. You can see by running the following commands and configuring autoscale we get the minimum and if we were to put a load onto these pods then this would dynamically provision more pods to handle the load. I was impressed and the lightbulb was flashing in my head.
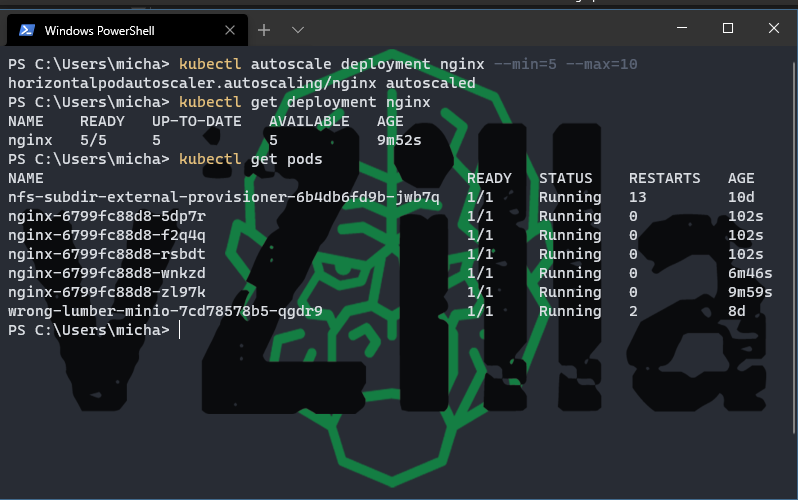
Ok, so we have a pod that is going to help us with load balancing our web traffic but for this to be useful we need to create a service and expose this to the network. This can be done with the following command; we are going to use the NodePort, to begin with as we did with the Kubernetes dashboard in the previous post.
kubectl expose deployment nginx –type NodePort –port 80
With this command you are going to understand the NodePort that you need to use to access the NGINX deployment from the worker nodes
kubectl describe svc nginx
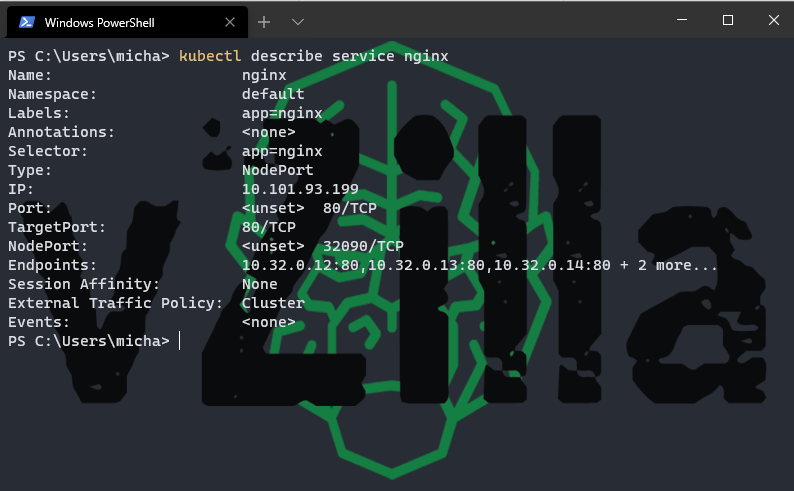
We then run the following command to understand which node address we need to connect to
Kubectl get pods –selector=”app=nginx” –output=wide
And we can see from the below that node is either node2 or node3
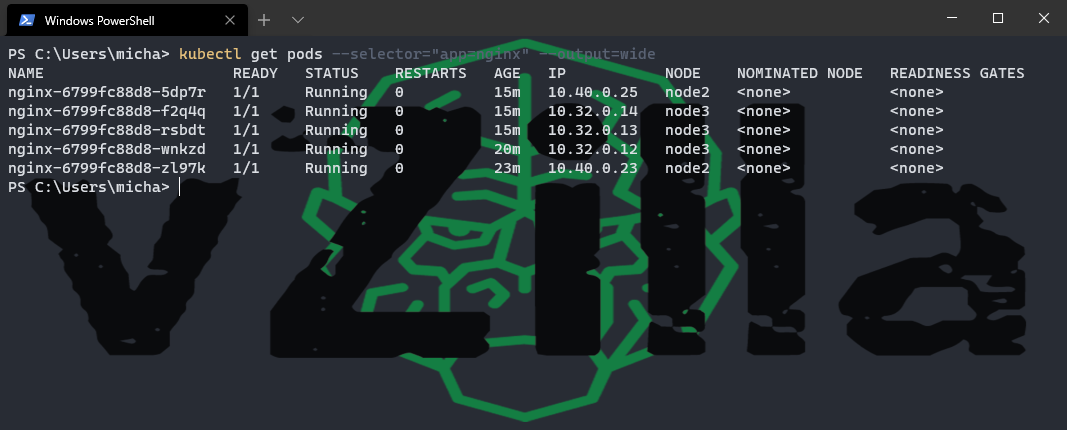
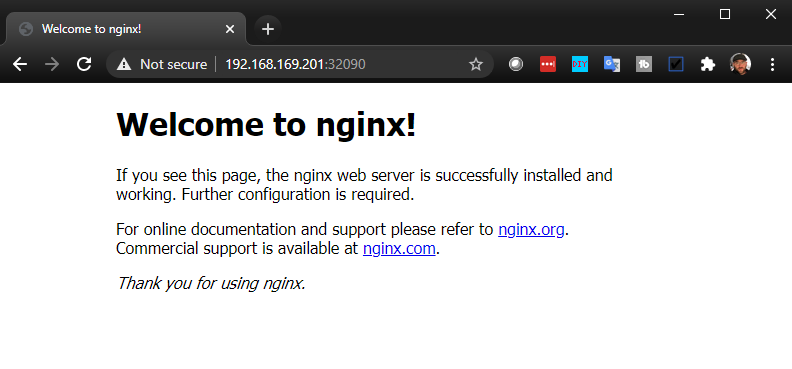
Open a web page with your worker IP address:NODEPORT Address and you should see the NGINX opening page.
Ok so all good we have our application up and running and we can start taking advantage of that I assume but what we should also cover is how you can take what you have just created and create a YAML file based on that so you can use this to create the same configuration and deployment again and again.
We created a deployment, so we capture this by running the below command to an output location you wish.
kubectl get deploy nginx -o yaml > /tmp/nginx-deployment.yml
same for the service
kubectl get svc nginx -o yaml > /tmp/nginx-service.yaml
Then you can use these yaml files to deploy and version your deployments
kubectl create -f /tmp/nginx-deployment.yaml
kubectl create -f /tmp/nginx-service.yaml
if created with YAML you can also delete with
kubectl delete -f /tmp/nginx-deployment.yaml
kubectl delete -f /tmp/nginx-service.yaml
We can also delete what we have just created by running the two following commands
kubectl delete deployment nginx
kubectl delete service nginx
I think that covered quite a bit and next we are going to get into persistent storage and some of the more stateful applications such as databases that need that persistent storage layer. As always please leave me feedback, I am learning with the rest of us so any pointers would be great.
]]>